The EIA’s Petroleum Supply Monthly

The EIA has just published their Petroleum Supply Monthly with US production, and other data, for July 2014. US C+C production fell by 3,000 barrels per day in July.

US C+C

After a big leap in April things have slowed down considerably in the last three months. US production in July was 8,537,000 barrels per day

UA Big Picture

This is US production since 1920. We are just over 1.5 million barrels per day below the monthly high of 10,044,000 barrels per day of in November 1970.
Read More

More David Archibald on LTO plus Net Imports

David Archibald has recently revised his peak date for shale oil. The below was contained in a recent post I received from him:

Ron,

For what it is worth, just to let you know that I have recanted on my estimate of US LTO production.

This is from reading the presentations put out in September by the US independents.   I started with the EOG presentation and then worked through the others that EOG referred to.  If Hubbert-type analysis works for LTO, it may be too early to apply it.

The rig count for the Bakken etc may be down to flat but the fraccing units are pumping a lot more sand and the economics of fraccing have improved a lot over the last two years.  That in turn means that the resource is larger at a given IRR cutoff.  This is currently my best guess of the three major plays:

David New 3

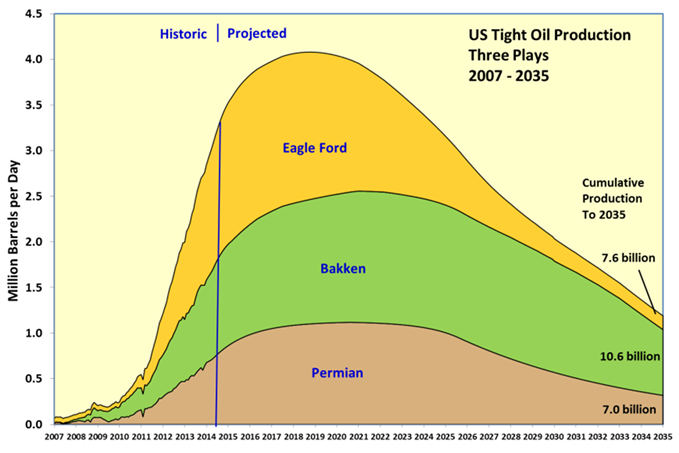
Others are appearing such as SCOOP in Oklahoma.

 I tried to make the graph useful by putting in the cumulative production to 2035 so that people can mentally adjust it for what they think EUR might be.  The Permian has a lot of NGLs and natural gas which means that the energy produced is about twice as large as the oil component.    The reason I didn’t make the Permian as peaky as the Eagle Ford for example is that there at lot of stacked plays in the Permian.  Once companies have got acreage and got one horizon working, they don’t have to be in a rush to develop the others.

 The US LTO boom is worth about two to three years of conventional oil decline:David New 4

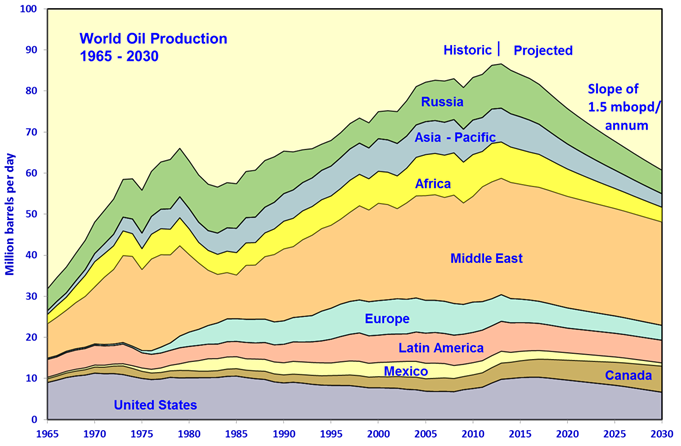
With further demand destruction, the US will become energy independent.
Read More

Texas RRC Data September Report

The Texas RailRoad Comission released their Oil & Gas Production Data with production data through July 2014. The data was actually released Thursday but was all messed up. They corrected their mistake Friday except for condensate. Then yesterday they updated everything. As I have stated before, the RRC data, for the last several months, is incomplete. Nevertheless we can gather some indication of what is happening.

Texas C+C

Texas C+C is still increasing at a pretty hefty clip. The EIA data is just an estimate of course but I think it is pretty close to what the data will show when it is all in. I have included six months of data to show how it is increasing month to month.

Texas Crude Only

Texas crude only was down in October and November but has been up every month since. The declines in the last few months is due to incomplete data.

Read More

World Oil Production According to the EIA

A few days ago the EIA published the latest update to its International Energy Statistics. The data is updated through May 2014. The data on all charts below is through May unless otherwise stated and is in thousand barrels per day. Also, all data is Crude + Condensate.

World

World C+C production was down 72,000 barrels per day in May to 76,540,000 bpd. It was down 708,000 barrels per day since reaching a new all time peak in February of 77,247,000 bpd.

Matt, on his blog Crude Oil Peak, is saying the same thing I have been saying for months. That is US shale oil growth covers up production drop in rest-of-world.

CrudeOilPeak

The trend is clearly down and is going to get worse. Below is my graph using the same data.

Read More

Bakken and N.D. Update for July

North Dakota has released their Bakken and North Dakota production numbers for July.

Bakken Barrels Per Day

Bakken production was up 19,456 bpd while all North Dakota production was up 18,134 barrels per day. This means that North Dakota production outside the Bakken fell by 1,322 bpd or a little over 2%.

Bakken Wells

Bakken wells producing increased by 195 to 8,065. North Dakota wells increased by the same amount to 10,952 so non-Bakken wells were unchanged at 2,860.

Read More