Who’s Got Liquids? plus Further to the Bakken

This is another Guest Post by David Archibald

Who’s Got Liquids?

An article by Canadian consultant Mike Priaro in the 7th July, 2014 edition of Oil andGas Journal, “Grosmont carbonate formation increases Alberta’s bitumen reserves”, included the following tables:

David 1

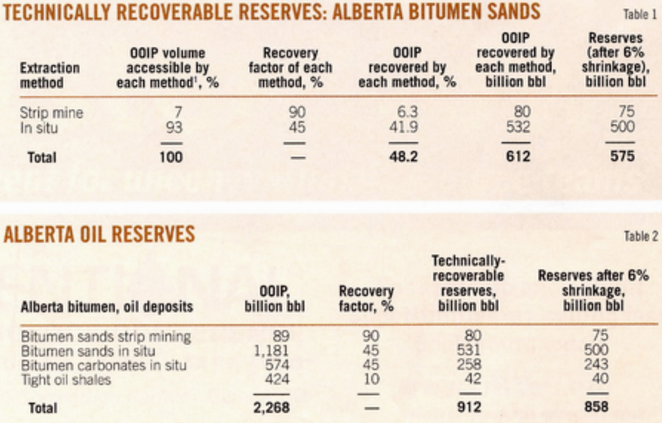
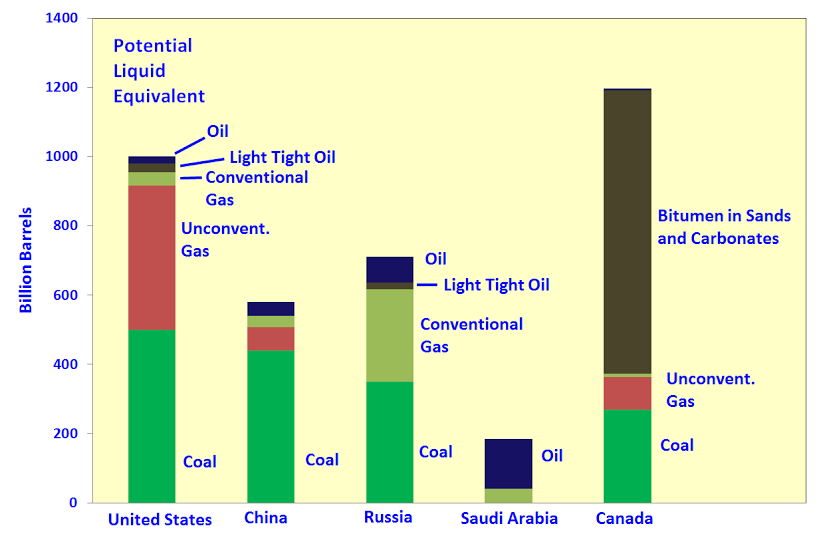
Mr Priaro’s estimate of Canada’s recoverable bitumen is 818 billion barrels. Almost all of that is in Alberta. Combined with their coal resources, Alberta has the biggest fossil fuel resource on the planet. I have updated my estimate of what some of the major countries have in the way of fossil fuels in this table:

David 2

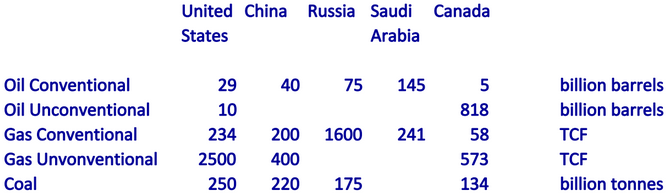
The highest value fuels are those that can be used as liquids in transport. High quality coal produces 2.2 barrels of liquids through a FT plant. In the following graphic I have used a factor of 2x to convert coal to its oil equivalent. Six thousand cubic feet of gas has the energy equivalent of one barrel of oil. Natural gas can be used directlyin some transport applications. Putting it through an FT plant to make diesel, for example, would lose at least 30% of its initial energy. Natural gas has traditionally traded at the oil price in the US and conceivably might return to close to that level in a tight market. So in the following graph, natural gas in TCF is divided by six to produce its oil equivalent in billions of barrels. This is the graph:

David 3

Read More

Bakken Oil Peak by Jean Laherrère

This is a guest post by Jean Laherrère

The problem of forecasting future Bakken production is that estimating reserves of shale oil is harder than for conventional oil and is very unreliable because many confuse reserves and resources, and shale oil reserves depend more from economy than from technology. Many estimate the amount of hydrocarbons generated by the source-rock and believe that a significant percentage could be recovered: the study of the main Petroleum Systems in the world estimate than only about 1% will recovered in conventional fields, no more could be expected in unconventional fields.
US Shale gas production started in 1821 in Fredonia for lighting when whale oil price was about 2000 $2014/b, but was replaced by conventional oil in 1859 because a largely lower price.

How to estimate future production?

Drilling activity is a good way to model production with a shift.
In my MIT Paris paper «The end of the peak oil myth» MIT club de France- Paris 28 April 2014, I was convinced that North Dakota oil production will peak within 2014 using a correlation between oil production and shifted number of rigs, guessing the value of the shift and the relationship between rigs and production.

Jean 1

This April 2014 graph is wrong when adding present data at July 2014 (still rising after a minor peak in November 2013) and I have changed the shift from 20 months to 30 months and the correlation oil/rig, but I feel uncertain about the reliability of such graph.
When active in exploration I was used to drill 9 dry holes out of 10 wildcats: I am used to be wrong and I am not afraid of that. To make discovery you have to take risks.
My new model forecasts ND oil production peak in 2015 at less than 1.2 Mb/d, but again this new model could be wrong as the old one.

Jean 2

My modeling was based on the Montana oil peaks, which fit well with the number of rigs shifted by 12 months since 2000.

Read More

Texas RRC Report + More About Russia

The Texas RRC Oil and Gas Production Data is out with the June production numbers. I must repeat, as I do every month, that this data is much delayed and is and will be subject to updates every month, for about two years. Of course the latest months will be the ones which will be subject to the greatest revisions.

All oil data is in barrels per day. The last data point on all charts is June 2014.

Texas Crude Only

I have six months of data here to give you some idea of the revisions that can be expected in the coming months. Texas crude only is still increasing. My guess is that it is increasing by about 40 thousand barrels per month.

Texas Condensate

Texas condensate declined for three months in June, July and August of 2013 but has now started to increase again. I estimate that Texas condensate is currently increasing but only some months. It looks like Texas condensate production in some months is declining but in other months is still increasing by as much as 4 to 6 thousand barrels per month.
Read More

Bakken Production Data for June + EIA Data

The Bakken and North Dakota production numbers are in for June. There was a big jump in oil production in June. The Bakken was up 53,162 barrels per day to 1,028,352 bpd. All North Dakota was up 52,148 bpd to 1,092,617 meaning the area outside the Bakken was down about 1,000 bpd.

Bakken Barrels Per Day

From the Director’s Cut:

May Sweet Crude Price = $88.31/barrel
June Sweet Crude Price = $90.03/barrel
July Sweet Crude Price = $86.20/barrel
Today’s Sweet Crude Price = $79.50/barrel (all-time high was $136.29 7/3/2008)

The drilling rig count was up one from May to June, and up two more from June to July.
The number of well completions increased as weather impacts eased in June with
significant rainfall on 2 days near Minot and 1 day near Dickinson. However, there were
still 6 to 8 days with wind speeds in excess of 35 mph (too high for completion work).

At the end of June there were about 585 wells waiting on completion services, a decrease
of 25.

For the first time in a couple of years he did not give us the exact number of new well completions, only that they increased. Last month there were 227 well completions and production was up 37,000 bpd so we can assume there were aroun 235 to 240 new well completions in June.

Well completions should not be confused with “additional wells producing. That is and entirely different figure.

ND New Wells

Additional wells producing is new wells completed, plus previously shut down wells brought back on, line minus wells shut down. Sometimes this number goes negative as it did in December of 2013. That month “Wells Producing” dropped by 52 even though there were 119 new wells completed. All data is barrels per day.

Read More

Global and Russian Energy Outlook to 2040

Like BP, OPEC, the EIA and the IEA Russia also publishes an annual energy outlook. It is called the Global and Russian Energy Outlook to 2040. It is published by The Energy Research Institute of The Russian Academy of Sciences and The Analytical Center for The Government of The Russian Federation. I have no idea who these guys are but their titles sound impressive and they seem to be Russian think tanks funded by the Russian Government. But that is just an assumption of mine.

It is a very large 175 page PDF file that appears to be very scholarly and well researched. However they appear to be very optimistic in their prediction of the future oil supply out to 2040.  In one scenario they are not optimistic at all for coal production however.

The report has three scenarios, the Baseline Scenario where business as usual continues until 2040. The New Producers Scenario where oil prices collapse due to overproduction and The Other Asia Scenario which is based on peak coal and the effect this will have on China and India. In that scenario they assume China coal production will peak within the next ten years. The Baseline Scenario assumes adequate supplies of coal will be available however. Only in the Other Asian Scenario do they figure in peak coal. All three scenarios assume plenty of oil will be available through 2040.

Russia Take Energy GrowthObviously they don’t see any peak in oil production out to 2040, only growth. However they have coal and gas growing even more. And they seem to be very optimistic about “other” renewables. I don’t know exactly what that might be.

Russia's Take Price

And here is their take with an oil price overlay. It appears they think, because production increases right along with demand, that the oil prices will remain flat.

Read More