World Crude Oil Exports

OPEC has released their Annual Statistial Bulletin 2014. Under the heading of “Oil and Gas Data” there are several tables you can download. I was excited to find one labeled “Table 3.21: World Exports of Crude Oil and Petroleum Products by Country”. It turned out to be useless however as it includes a lot of exports of imported products. And they have no table of “Net Imports”. However their their table labeled Table 3.18: World Crude Oil Exports by Country” turned out to be very useful as it seems to measure the same thing as the EIA does in their International Energy Statistics, Crude Oil Exports which also includes lease condensate.

The OPEC export data goes back to 1960 but I have only plotted it from 1990. The EIA data only goes back to 1993. The OPEC data is through 2013 while the EIA data only goes through 2010 except for Canada, Mexico and Norway which goes through 2012. All data is in thousand barrels per day.

World Exports

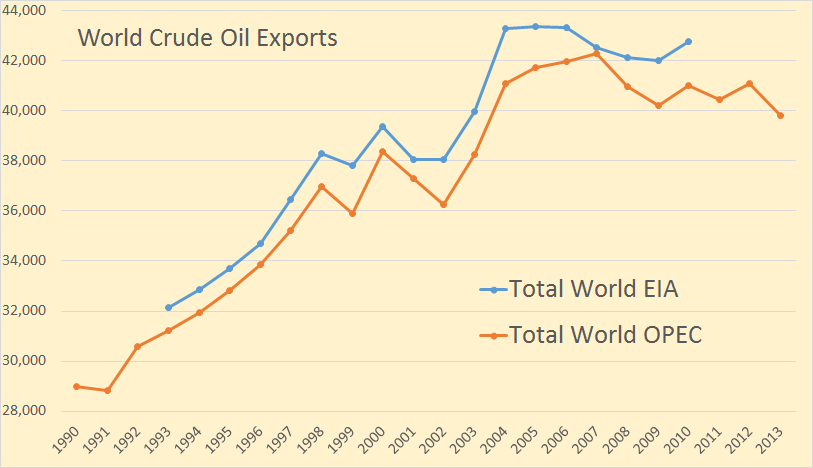
World crude oil exports peaked in 2007 and now stand 42,297,000 bp/d and in 2013 stood 2,467,000 bp/d below that point. World crude oil exports in 2013 were 2,467,000 barrels per day below peak and at the lowest point in 10 years.

OPEC Exports

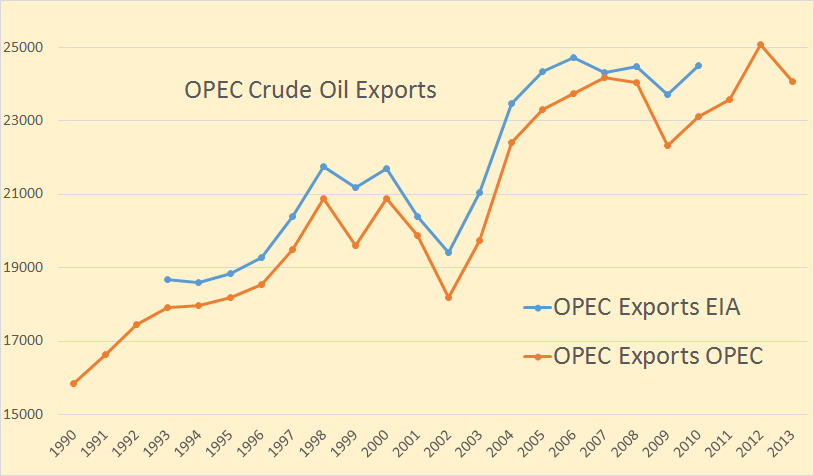
OPEC exports peaked, so far, in 2012 at 25,068,000 barrels per day. Their exports fell by just over 1,000,000 barrels per day last year and I am betting they will fall further this year.

Non OPEC Exports

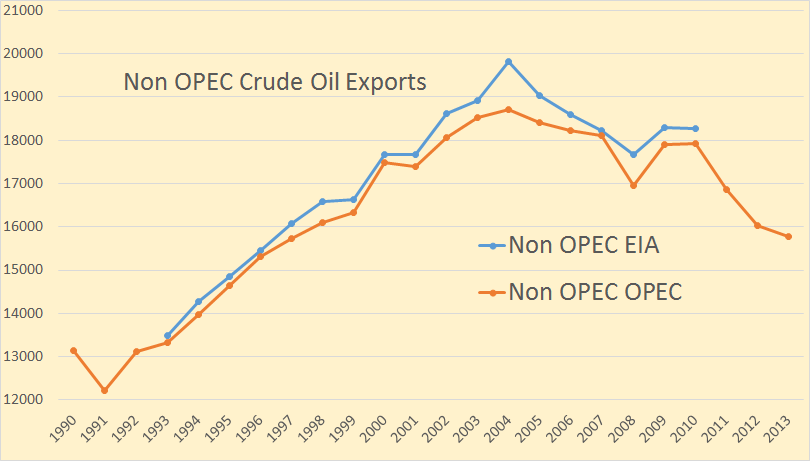
Non-OPEC exports have taken a hit in the last few years, peaking in 2004 and are down just under three million barrels per day since then.

Read More

Anticipating the Peak of World Oil Production

These are indeed good times to be a Peak Oiler. All the  peak oil deniers are dancing with wild exuberance, pointing to that spike of US shale oil production that they believe drives the final nail in the “Peak Oil Theory” coffin. And it is all happening right before reality slaps them in the face.

There is no doubt that world Crude + Condensate production, without that tight oil spike, has been on a ten year bumpy plateau.

World Less USA A

But, you may ask, when the shale bubble burst, won’t that only mean we will still stay on that bumpy plateau? No for several reasons. First the bursting of the shale bubble will likely cause a decline in US production of perhaps half a million barrels per day per year for three to four years. Second Russia, whose production increase of over 1.5 million barrels per day over the past ten years has kept us on this bumpy plateau, is now in decline.

And third, five nations that have shown considerable increase over the past few years now seem to have peaked.

China et al

These five nations, who’s 2 million barrel per day increase since mid 2004, have also kept us on that plateau. Their combined production plateaued a year and a half ago. I don’t expect them to decline very fast but they will not add anything to world production in the next few years.

Read More

Texas RRC July Oil and Gas Report with May Production Numbers

The Texas Rail Road Commission has just released their Oil & Gas Production Data through May. There are four categories of data, Crude, Condensate, Gas Well Gas and Casinghead Gas. Casinghead gas is what most folks call Associated Gas. That is gas that comes up with the oil in oil wells.

On all oil charts the July Report has data through May 2014 and is in barrels per day. Also the last month, May in this case, is always exaggerated on the low side. That is the data is incomplete back to about two years. But the last month is always far more incomplete than the previous months.

Texas Crude Only

This data is of course incomplete but even from the incomplete data we can get an idea of the average monthly increase. I calculate that Texas Crude only is increasing at about 40,000 barrels per day per month.

Texas Condensate

I think Texas Condensate peaked back in May of 2013 and is now declining at about 500 bp/d per month.
Read More

Collapse is Inevitable

There has been considerable discussion lately as to whether or not total collapse of the world’t economies will happen in the relatively near future. I think that is the wrong question. Let me explain.

Ecological collapse of the world’s ecosystem is a lead pipe cinch. It is already well underway and instead of slowing down, it is gaining momentum fast. Here are just a few examples from recent news.

‘Peak soil’ threatens future global food security

“Under business as usual, the current soils that are in agricultural production will yield about 30 percent less than they would do otherwise by around 2050.”

Surging food consumption has led to more intensive production, overgrazing and deforestation, all of which can strip soil of vital nutrients and beneficial micro-organisms, reduce its ability to hold water and make it more vulnerable to erosion.

Such factors, exacerbated by climate change, can ultimately lead to desertification, which in parts of China is partly blamed for the yellow dust storms that can cause hazerdous pollution in Asia, sometimes even severe enough to cross the Pacific Ocean and reduce visibility in the western United States.

“If we keep treating our soil the way we do, we will have to convert about 70 percent of the earth’s surface into agriculture to meet demand for food by 2050 (from about 40 percent now), Crawford said.

Crawford also noted that moderately degraded soil could only store about half the amount of water of good soil, adding to pressure on limited water resources.

Cheap fat may ‘spell doom’ for Africa’s great apes

Scientists warned Thursday that a palm tree with an oily fruit might “spell doom” for Africa’s great apes, thanks to demand for palm oil, a cheap fat often used as a replacement for trans fats.

But that land is running out.

“Everything is flattened, often burned. There are scars of burning that is completely devoid of anything. It’s like a biodiversity disaster zone,” Wich said. “It’s quite hard to see.”

The island of Borneo, below, the only habitat of the Orangutan, is almost deforested. The land has been cleared to grow palm oil. Only the central mountainous area remains for them to dwell. And those central slopes are today being cleared to grow more palm oil.

Deforestation Borneo

The only great ape, other than humans of course, outside Africa will be extinct in less than 20 years. And soon after that all the other great apes in Africa will be gone also.
Read More

Bakken, North Dakota & Production by County

North Dakota published their Bakken Production Data yesterday along with their North Dakota Production Data. This all happened the same day the EIA’s Drilling Productivity Report came out. This has resulted in two post in two days.

All charts below are in barrels per day with the last data point May 2014 even though the horizontal axis may only go through April 2014.

What type of chart is preferable to most folks, the below type?

Bakken Stacked

Or this type?

Bakken Barrels Per Day

This was a good month for the Bakken. Production was  up 36,653 bp/d to 974,695 bp/d. All North Dakota was up 36,379 bp/d to 1,039,635 bp/d. This meant that North Dakota production outside the Bakken was down 274 bp/d to 64,940 bp/d.

From the Director’s Cut, bold mine:

The drilling rig count was up slightly from April to May, and from May to June the rig
count increased by one. The number of well completions increased 14% to 227, but weather continued to impact activity in May with 2 days of heavy rain near Dickinson and 5 to 6 days with wind speeds in excess of 35 mph (too high for completion work).

At the end of May there were about 610 wells waiting on completion services, an
increase of 10.
Read More