Is Peak Oil Waiting for Godot?

Waiting for Godot was a two act play by Samuel Beckett where two men kept waiting for Godot and they just kept waiting and waiting and waiting… And no, I don’t think we will be kept waiting and waiting like the characters in that play. Peak oil is about to arrive, in my opinion anyway.

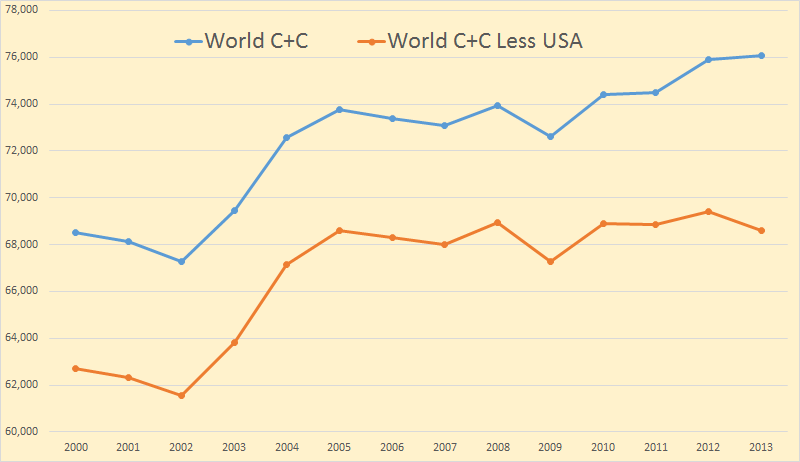
Way back in 2005 we thought it likely that crude oil production had peaked at just under 74 million barrels per day. During the preceding three years C+C production had risen by 6,481,000 barrels per day or 2,160,333 barrels per day per year. The reason for that dramatic increase was a doubling in the price of oil from $25 per barrel in 2002 to $54.43 in 2005.

So oil production depends, to a great extent, the price of oil. The more money the more oil. However…  The C+C data in all charts below are in thousand barrels per day.

Brent Price Vx. Production

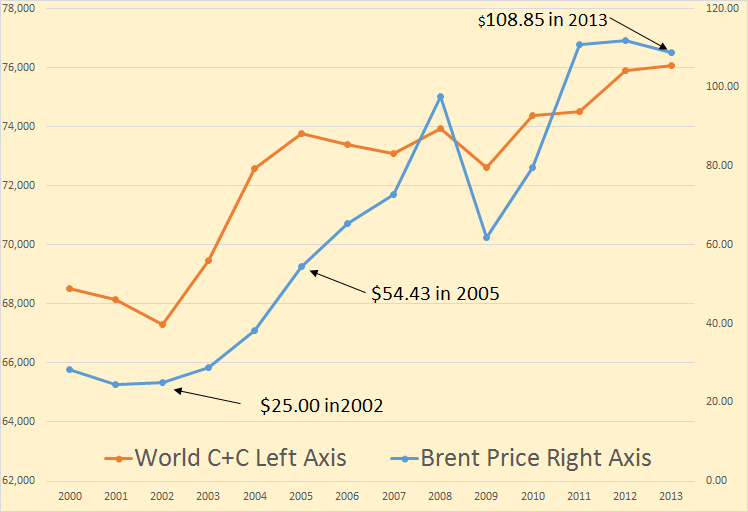
 You can see that another doubling of Brent oil price in the next 8 years brought only 2,283,000 bp/d of new oil on line, or an average of 285,375 bp/d per year.

So where did the increase in C+C come from between 2002 and 2005, and where has it come from since.

Change Since 2002

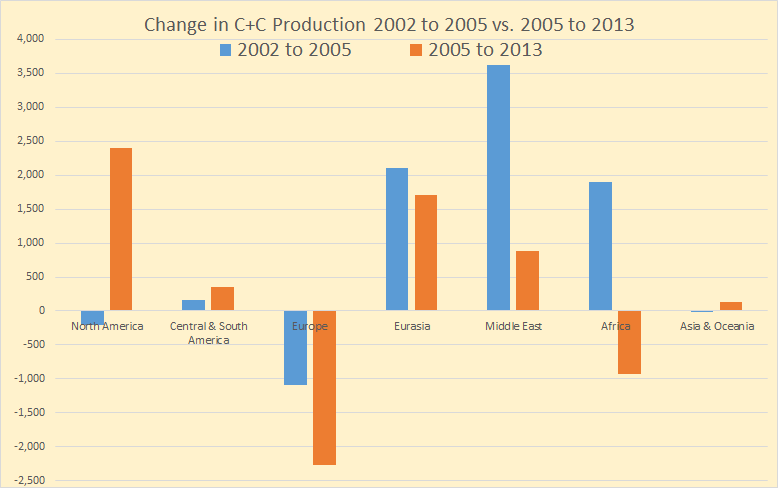
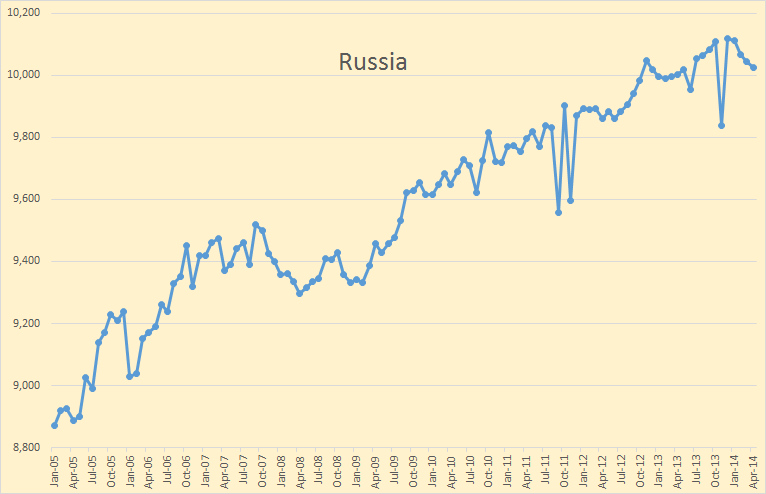
You can see the major addition to World C+C between 2002 and 2005 was from Eurasia, (FSU) the Middle East and Africa. The only major decline was from Europe, primarily the North Sea. Since 2005 the major gainers were North America followed by the Middle East and Eurasia, which we used to refer to as FSU. But 8 years is a long time, what has happened during those 8 years.
Read More

EIA’s International Energy Statistics Updated

The EIA has finally updated their International Energy Statistics. They were a month behind so they caught up by updating two months of data. The last update had data through October. This update has the data through December 2013. They also updated their annual data page.

If you click on the link, then mouse over “Petroleum, Production” and click, you will get “Total Oil Supply”. That data is everything including ethanol, biodiesel, NGLs and even refinery process gain. I never use that data. After that page comes I go to the box labeled “Total Oil Supply” then click on the down arrow, then click on “Crude Oil including Lease Condensate” That is the data I use, that is all I use.

World Yearly

From the annual data I found total World C+C was up a mere 167 kb/d. US production was up 967 kb/d. That means that the World less USA was down 800 kb/d.

I have been following Russia pretty close on their website CDU TEK.

Russia CDU TEK

The data through December is from the EIA. The last four months, through April, I gleaned from the Russian website. Their data is daily in tons per day. I had to convert it and average it into monthly data but it is pretty close. Also, because the data on the above chart is non-zero based the increase appears greater than it really is. The increase averages out to be about one hundred thousand barrels per year.

I don’t know what the anomaly was in November. The JODI data does not show that but actually shows a peak in November 2013 above December.

Everyone has been expecting Russia to peak for several years. But their production has just kept inching up a little each year. This report is from five years ago: Alex Burgansky: Russian Oil and Gas Industry Surprises Analysts. Requires registration.

There are plenty of projects in Russia, both, new projects and existing brownfield projects. Russia is a very mature producer. If you exclude all the drilling activity taking place every year, then Russian organic decline in production is close to 19%. To compensate for that organic decline, Russia drills somewhere between 5,000 and 6,000 wells every year.

 This year, as I said before, some people expected production to collapse. We certainly never thought it would collapse, but we did think it would decline. Instead it’s actually growing as a result of benefits from past investments in the new fields coming on stream this year. But we’re simply running out of the pipeline of these new fields. Therefore, next year there will be a lot fewer fields coming on stream; in the absence of new incentives to put more money to work to grow Russian oil production, it will naturally start declining, with organic decline rates of around 19% and growing.

Read More

Texas RRC Report, also The Seven Sisters

The Texas RRC has released their new monthly production report:
RRC Online System Oil & Gas Production Data Query

In the below chart I have posted last month’s data in order to show the revisions. The last data point for the April report is February, for the March report and the EIA data it is January. All data is in barrels per day.

Texas RRC

The revisions were considerable. I have charted the revisions in barrels per day in order to better show the magnitude.

Texas Revisions

Pertinent revisions go back to February 2012 which was revised upward by 1,145 bp/d. But of course the big revisions are in the most recent months with January revised up by 146,716 bp/d and progressively smaller after that. December was revised up by 86,856 bp/d.

I have come to the opinion that the EIA has their estimate pretty close. Perhaps a tad high but very close nevertheless.
Read More

Oil Supply, Oil Price and the Economy

There has been considerable debate lately on what effect the supply and price of oil is having on the economy. It is, to my mind, a lot more serious than the vast majority of economists believe. In fact one can just look at what is happening today to see the effect of a constrained oil supply and high oil prices. Just look at the unemployment rate:

Shadow Unemployment

Real unemployment is double what it was in 2007. And it is creeping higher.

If you have not watched Oil Supply and Demand Forecasting with Steven Kopits then you have missed the best and most informative video that has come along since this whole debate started over a decade ago. I have just finished watching it for the third time. This time I made notes.

Kopits makes it very clear that oil is a binding constraint on economic growth. Of course that is obvious to most of us but you would be surprised at how many economists deny this. But for starters a few charts from Kopits video:

Kopits 2

This is a direct result of the high price of oil.

Read More

Eagle Ford Update

efchart/

Figure 1

 This was also posted at Peak Oil Climate and Sustainability

It has been a while since I have updated my estimate of actual output from the Eagle Ford.

Kevin Carter (KC at Peak Oil Barrel) graciously offered help pulling together data for the 39 fields which make up the Eagle Ford play (see this page at the RRC of TX, spreadsheet download here .)
Kevin has strong programming skills in Visual Basic for Applications (VBA) and has made the job of gathering the Eagle Ford data considerably easier.  Thank you Kevin!

My previous estimates only included the Eagleville fields (Eagle Ford 1 and Eagle Ford 2 and the inactive Eagle Ford and Eagle Ford Sour fields), Briscoe Ranch, Sugarkane, Dewitt, Gates Ranch, Hawkville, and Eagle Ridge fields.  Together these 10 fields produce about 99% of Eagle Ford C+C output so these previous estimates are not bad, this new estimate includes all Eagle Ford output reported by the RRC from June 1993 to January 2014.

Note that from June 1993 to Dec 2006 C+C monthly output from the Eagle Ford play was 12 b/d or less, which is why the chart starts at Jan 2007.

An Excel spreadsheet with the data can be downloaded here .  More below the fold.

Read More