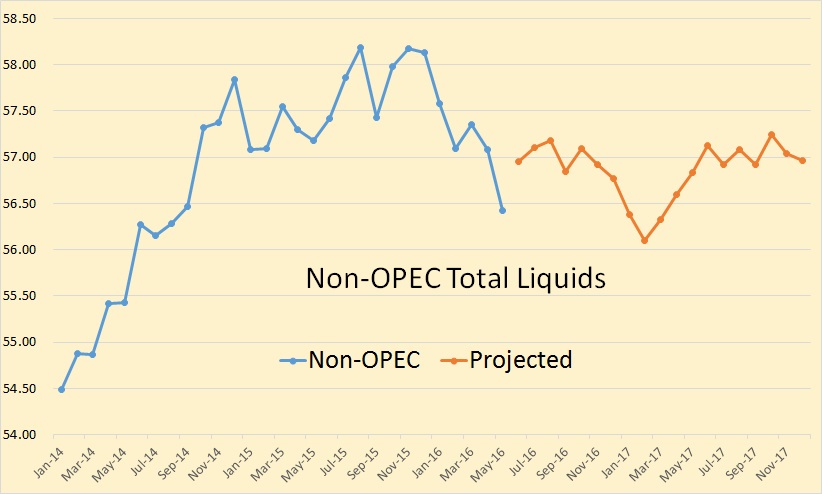
The EIA’s Short Term Energy Outlook is out. The data is in million barrels per day.

Not much has changed in the EIA’s projection since last month, however their projection for the remainder of this year and next year has increased slightly.
The EIA’s Short Term Energy Outlook is out. The data is in million barrels per day.

Not much has changed in the EIA’s projection since last month, however their projection for the remainder of this year and next year has increased slightly.
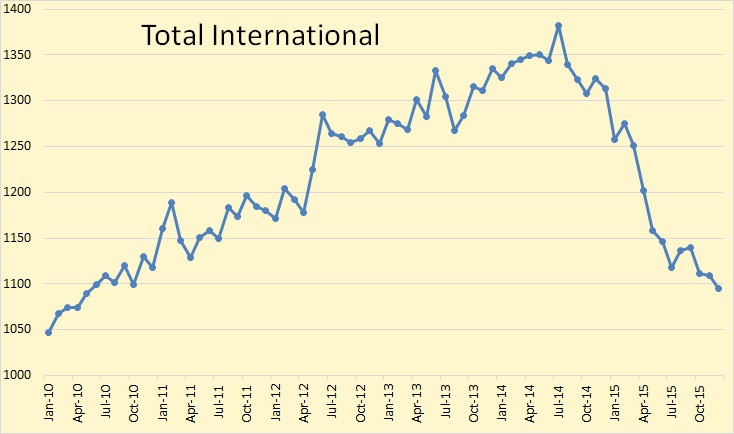
The monthly Baker Hughes International Rig Count came out a few days ago. Baker Hughes international rig counts do not include US, Canada, FSU countries or on shore China. All rig count data here is through December 2015 and includes all rigs, gas, oil and misc.

Total international rig count was down 14 rigs from November to December. From December 2014 to December 2015 rig count was down 218 rigs or 16.6 percent.
The Baker Hughes International Rig Count is out. I have decided to try something new with the charts. That is to compare the current year’s rig count with the previous two years count and to insert, within the charts, the percent change for this year as compared to last year. Also, this is the total rig count, Oil and Gas. Also the charts are not zero based. I do this in order to better emphasize the monthly change.
July usually sees a big jump in rig counts. This year there was a very tiny July increase, only a fraction of the increase we usually see for July.
*The Total International rig counts does not include the USA, Canada or the FSU. The Total International rig count was down 28 in July to 1118. Last July it was up3 to 1344.