What Will 2015 do for Peak Oil?

The Cornucopians are exuberant, they believe that collapsing of oil prices dealt the death knell for peak oil. An oil glut, they say, is what we have, not peak oil. But an oil glut is exactly what we would expect at the very peak. After all, that is what peak oil is, that is the the point in time when the world produces more oil than ever in history… and the most it ever will produce.

I am of the firm conviction that the world is at the peak of world oil production right now, or was at that point three or four months ago. I think history will show that the 12 months of September 2014 through August 2015 will be the one year peak. Whether the calendar year peak is 2014 or 2015 is the only thing still in question, or that is my opinion anyway.

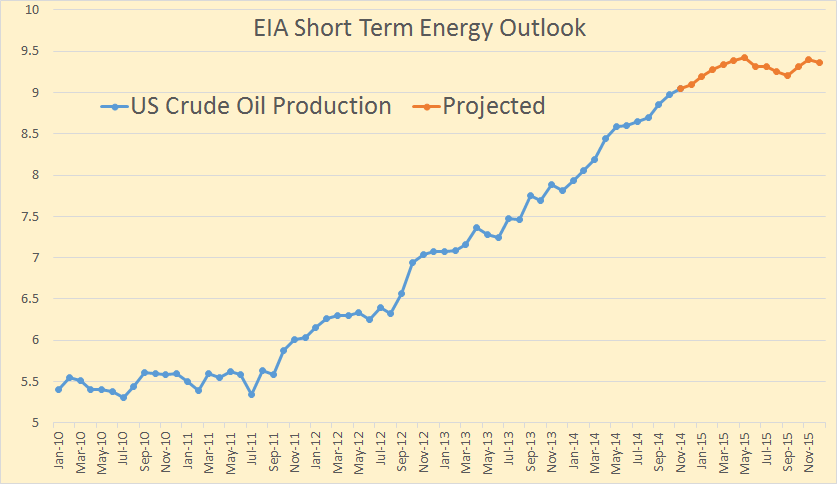
The EIA says, in their Short Term Energy Outlook says US Crude oil will peak, at least temporarily, in May 2015.

STEO 1

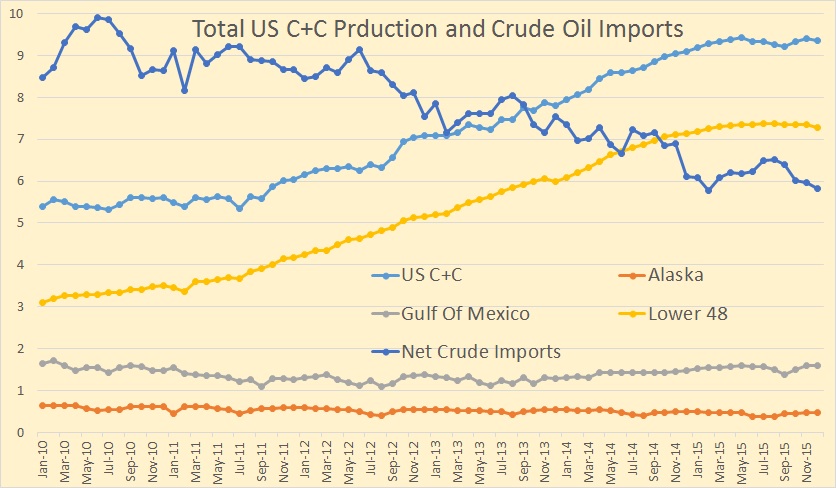
Looking at the area breakdown for total US production:

STEO Total US

This chart includes net US crude oil imports. Notice how they expect crude oil imports to bottom out in February of 2015 at 5.78 mbd then increase to 6.71 mbd in August before declining to 5.82 mbd in December.

Read More

World Oil Production, September Numbers

The EIA has published International Energy Statistics with Crude + Condensate numbers for September 2014. As most of you know I only follow Crude + Condensate because I believe that biofuels and natural gas liquids should not be part of the peak oil equation.

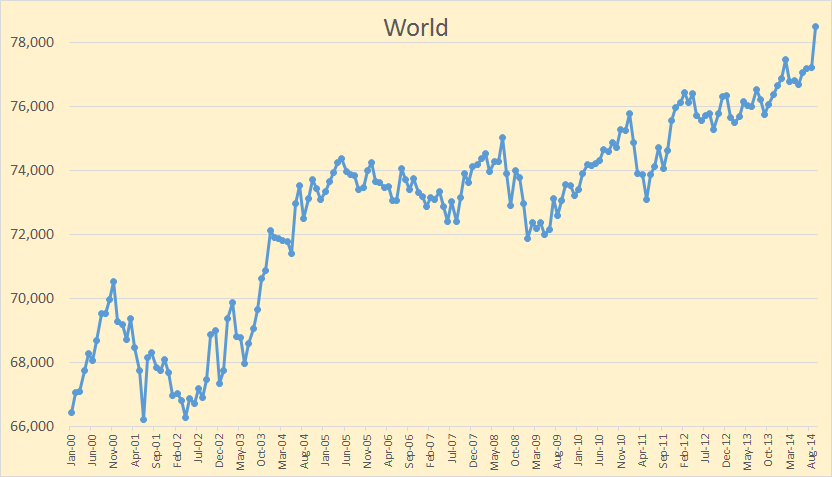
The data in all charts is thousand barrels per day with the last data point September 2014.

World

World oil production was up 1,270,000 barrels per day in September. This was somewhat of a shocker. I had expected production to be up about .9 mbd but not this much.

Non-OPEC

Non-OPEC nations accounted for 833,000 bp/d of the increase.

OPEC C+C

And OPEC nations accounted for 438,000 bpd of the increase. The EIA said OPEC produced 32,734,000 barrels per day of C+C in September. OPEC’s “secondary sources” said OPEC produced 30,560,000 barrels of Crude Only in September. OPEC’s crude only production had dropped to 30,053,000 bpd in November, or over half a million barrels per day lower.

Read More

World Oil Production According to the EIA

A few days ago the EIA published the latest update to its International Energy Statistics. The data is updated through May 2014. The data on all charts below is through May unless otherwise stated and is in thousand barrels per day. Also, all data is Crude + Condensate.

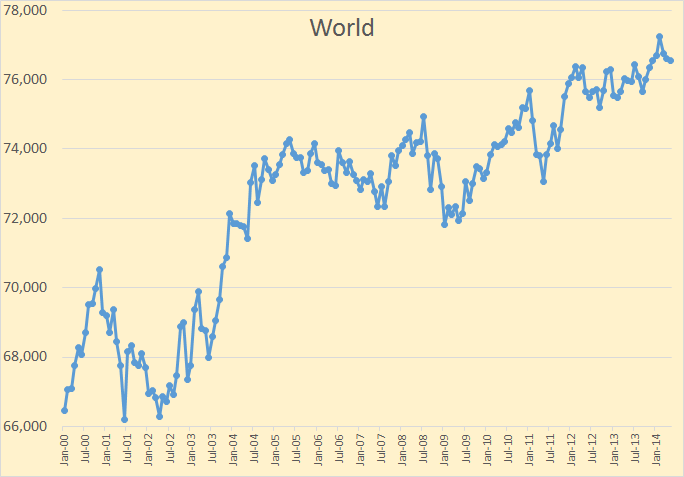
World

World C+C production was down 72,000 barrels per day in May to 76,540,000 bpd. It was down 708,000 barrels per day since reaching a new all time peak in February of 77,247,000 bpd.

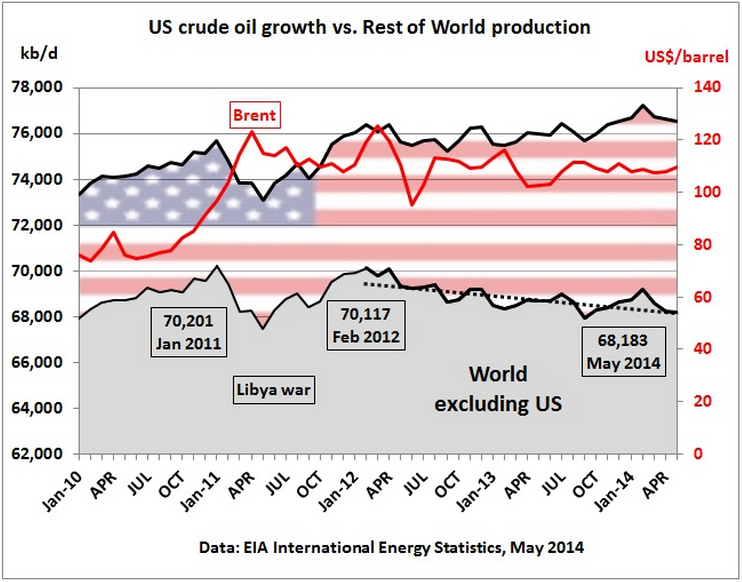
Matt, on his blog Crude Oil Peak, is saying the same thing I have been saying for months. That is US shale oil growth covers up production drop in rest-of-world.

CrudeOilPeak

The trend is clearly down and is going to get worse. Below is my graph using the same data.

Read More

World Energy 2014-2050 (Part 1)

This is a guest post by Political Economist

World Energy 2014-2050: An Informal Annual Report

 “Political Economist” June 2014

The purpose of this informal report is to provide an analytical framework to track the development of world energy supply and demand as well as their impacts on the global economy. The report projects world supply of oil, natural gas, coal, nuclear, hydro, wind, solar, biofuels, and other renewable energies from 2014 to 2050.  It also projects the overall world energy consumption, gross world economic product, energy efficiency, and carbon dioxide emissions from 2014 to 2050.

The basic analytical tool is Hubbert Linearization, first proposed by American geologist M. King Hubbert.  Despite its limitations, Hubbert Linearization provides a useful tool helping to indicate the likely level of ultimately recoverable resources under the existing trends of technology, economics, and geopolitics.  Other statistical methods and some official projections will also be used where they are relevant.

Oil

According to BP Statistical Review of World Energy 2014, world oil consumption (including crude oil, natural gas liquids, coal-to-liquids, gas-to-liquids, and biofuels) reached 4,185 million metric tons (91.3 million barrels per day) in 2013, 1.4 percent higher than world oil consumption in 2012.  In 2013, oil consumption accounted for 32.9 percent of the world primary energy consumption.

World oil production (including crude oil and natural gas liquids) reached 4,133 million metric tons (86.8 million barrels per day) in 2013, 0.6 percent higher than world oil production in 2012.  Figure 1 shows oil production by the world’s five largest oil producers from 1965 to 2013.
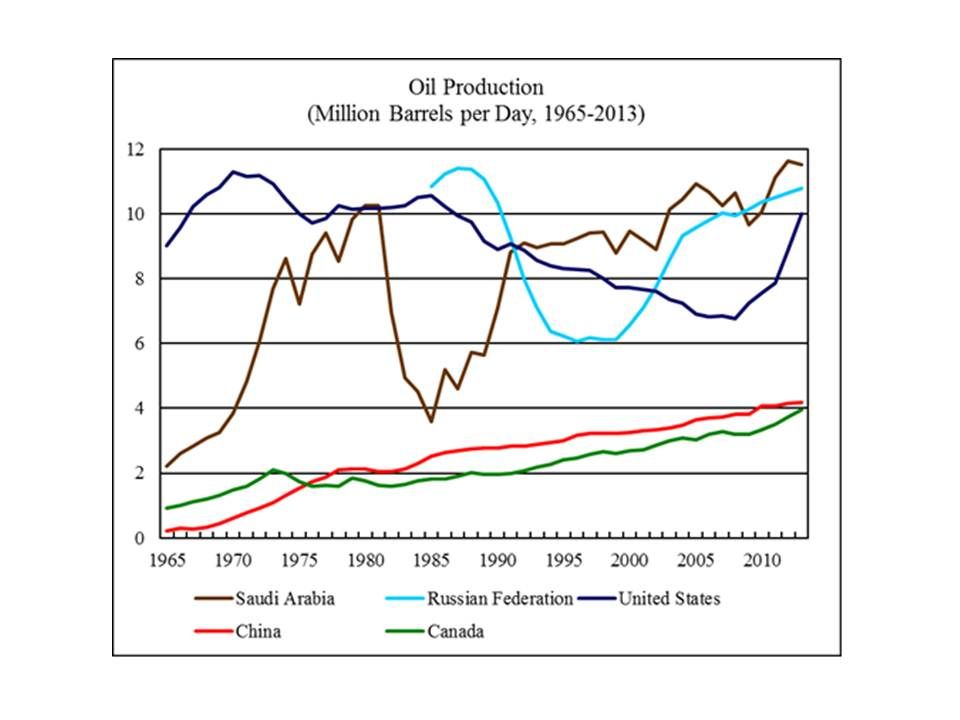
 photo Oil062014-1_zpsc4e13cc7.jpgAs of 2013, world “proved” oil reserves stood at 238 billion metric tons, 1.0 percent higher than the “proved” oil reserves in 2012.

In recent years, the US oil production has surged due to the “shale oil” boom.  The US accounted for all of the growth of world oil production from 2008 to 2013.  Figure 2 shows the historical and projected US oil production from 1950 to 2050.  The projection is based on the reference case scenario for US oil production from 2011 to 2040 projected by the US Energy Information Administration (EIA), extended to 2050 based on the trend from 2031 to 2040.  The EIA reference case projects the US oil production to peak in 2019, with a production level of 543 million metric tons.
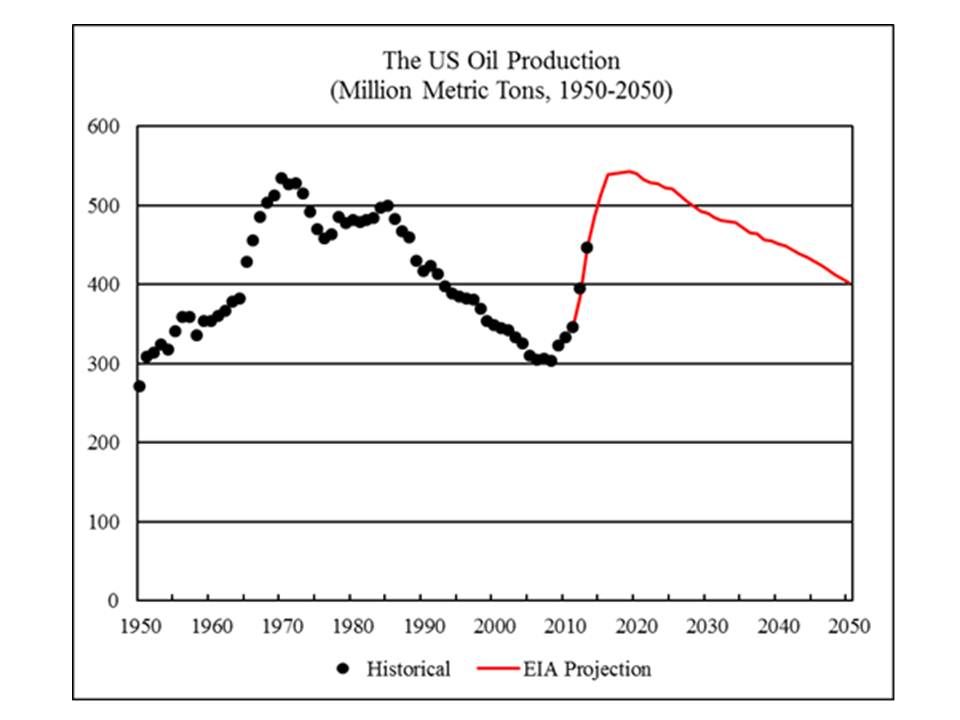
 photo Oil062014-2_zps187c496f.jpg
Read More

EIA’s International Energy Statistics Updated

The EIA has finally updated their International Energy Statistics. They were a month behind so they caught up by updating two months of data. The last update had data through October. This update has the data through December 2013. They also updated their annual data page.

If you click on the link, then mouse over “Petroleum, Production” and click, you will get “Total Oil Supply”. That data is everything including ethanol, biodiesel, NGLs and even refinery process gain. I never use that data. After that page comes I go to the box labeled “Total Oil Supply” then click on the down arrow, then click on “Crude Oil including Lease Condensate” That is the data I use, that is all I use.

World Yearly

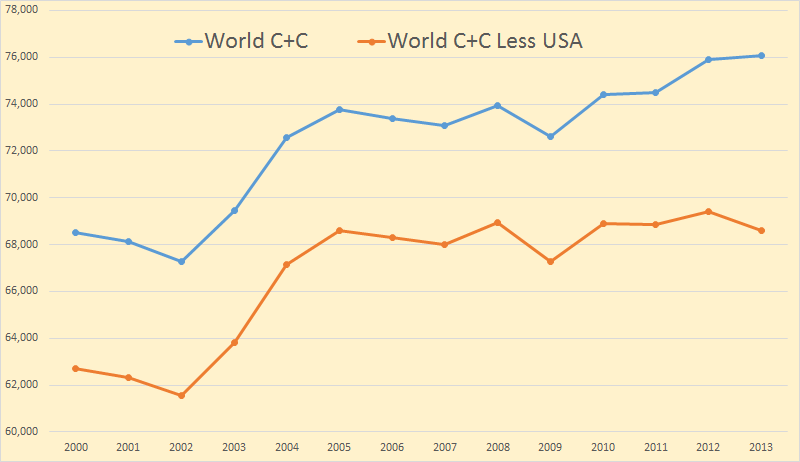
From the annual data I found total World C+C was up a mere 167 kb/d. US production was up 967 kb/d. That means that the World less USA was down 800 kb/d.

I have been following Russia pretty close on their website CDU TEK.

Russia CDU TEK

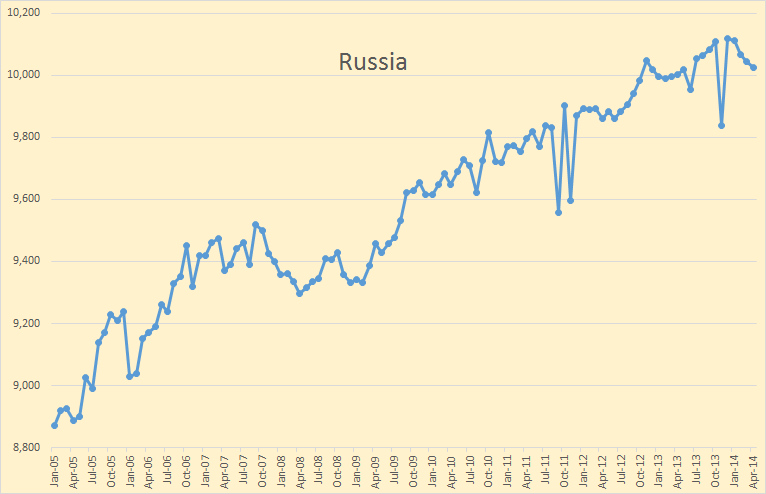
The data through December is from the EIA. The last four months, through April, I gleaned from the Russian website. Their data is daily in tons per day. I had to convert it and average it into monthly data but it is pretty close. Also, because the data on the above chart is non-zero based the increase appears greater than it really is. The increase averages out to be about one hundred thousand barrels per year.

I don’t know what the anomaly was in November. The JODI data does not show that but actually shows a peak in November 2013 above December.

Everyone has been expecting Russia to peak for several years. But their production has just kept inching up a little each year. This report is from five years ago: Alex Burgansky: Russian Oil and Gas Industry Surprises Analysts. Requires registration.

There are plenty of projects in Russia, both, new projects and existing brownfield projects. Russia is a very mature producer. If you exclude all the drilling activity taking place every year, then Russian organic decline in production is close to 19%. To compensate for that organic decline, Russia drills somewhere between 5,000 and 6,000 wells every year.

 This year, as I said before, some people expected production to collapse. We certainly never thought it would collapse, but we did think it would decline. Instead it’s actually growing as a result of benefits from past investments in the new fields coming on stream this year. But we’re simply running out of the pipeline of these new fields. Therefore, next year there will be a lot fewer fields coming on stream; in the absence of new incentives to put more money to work to grow Russian oil production, it will naturally start declining, with organic decline rates of around 19% and growing.

Read More