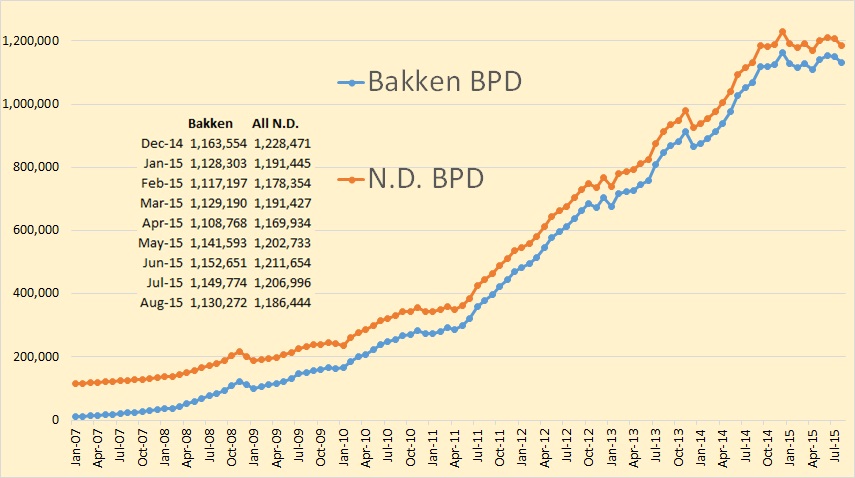
Looking Back 10 Years After Peak Oil

This is a guest post by Verwimp Bruno.

All views expressed here are those of Verwimp Bruno and do not necessarily represent those of Ron Patterson.

1. INTRODUCTION

Introduction

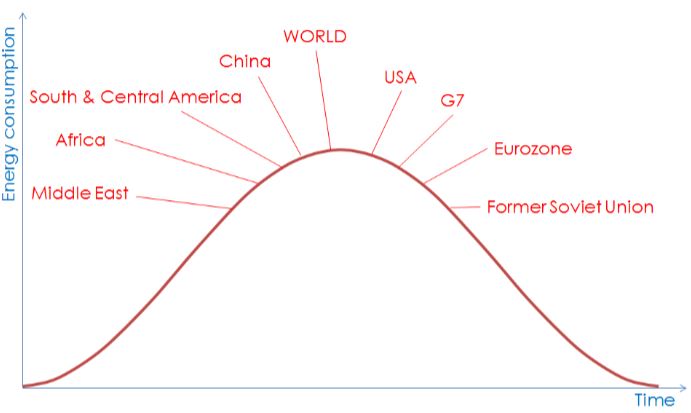
Peak Oil is the moment in time when, on a global scale, the maximum rate of oil production is reached. The moment after which oil production, by nature, must decline forever. Since Earth is a closed system, next to this production (supply) event, there must be an equal demand event: Peak Oil Consumption. Since there are no substantial above ground deposits, Peak Oil Production and Peak Oil Consumption must coincide. The world consists of a lot of different countries, some of which are already far beyond peak oil production That leads to the assumption the world as a whole reaches peak oil production. On the demand side, it is worth looking, because different countries have different economies, different degrees of development, and so on, if, while some countries still experience significant growth in oil consumption, some countries are already well beyond Peak Oil Consumption by now. Read More
World Oil Output Last 3 Years

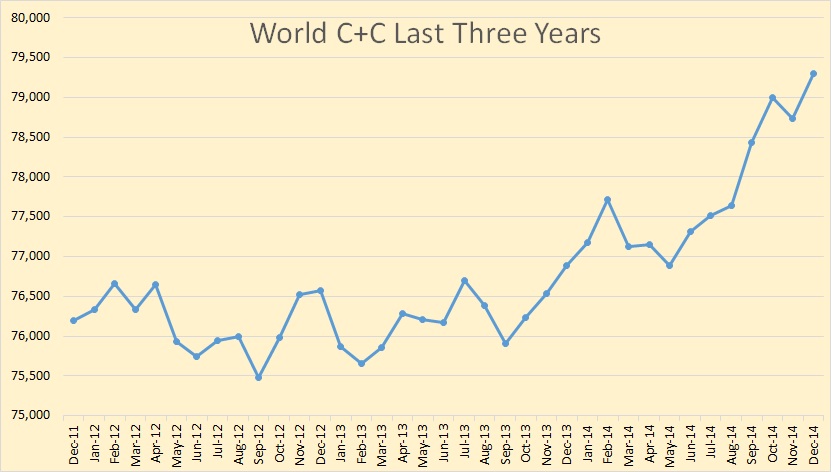
The EIA publishes every possible energy stat for the USA and hardly anything for the rest of the world. Well, anything current for the rest of the world anyway. Their International Energy Statistics is already five full months behind and working on six. December 2014 is the last international oil production data we have.

Anyway during this lull in other data I decided to look at the last three years of international data, from December 2011 to December 2014. All data is in thousand barrels per day.Post 1

World C+C production was flat for most of 2012 and 2013 but in late 2013 production took off and has increased by about 3 million barrels per day above the average for 2012 and 2013. December C+C production was 79,300,000 BPD.

Read More

Peak Russia + Peak USA means Peak World

Since around 2005 many countries have increased their oil production but more have decreased. But the combined production of the United States and Russia have kept the world on a slight uptrend since that time.

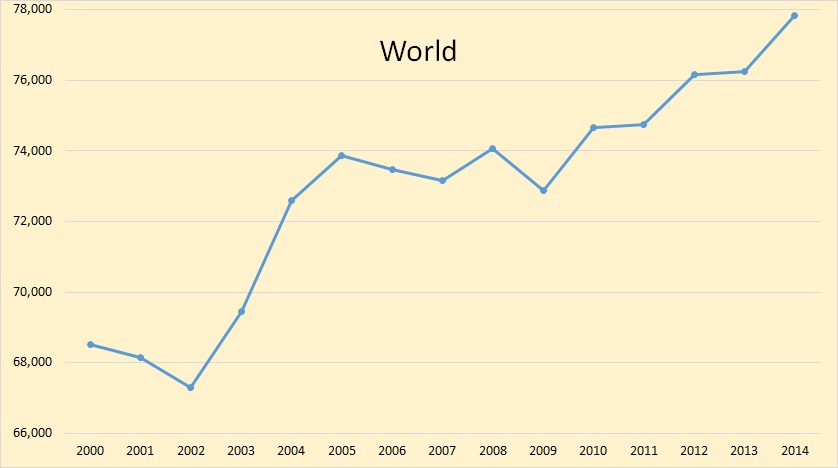
World since 2000

World oil production jumped in 2011, hardly moved at all in 2013 but it was up by more than  1.5 million barrels per day in 2014. And after such a huge gain everyone and their brother were singing “peak oil is dead’. But if you scroll down through the 37 major world oil producers it becomes obvious that a majority of nations have peaked and most of them are in steep decline.

The above chart is EIA data however the next four charts below are JODI data with the last data point February 2015. The data on all charts is thousand barrels per day.

Read More

The Oil Shock Model with Dispersive Discovery- Simplified


This is a guest post by Dennis Coyne

Originally posted at peak oil climate and sustainability

Some changes have been made to this post see after the Excel File link.  Below figure 10.

The Oil Shock Model was first developed by Webhubbletelescope and is explained in detail in The Oil Conundrum. (Note that this free book takes a while to download as it is over 700 pages long.) The Oil Shock Model with Dispersive Discovery is covered in the first half of the book. I have made a few simplifications to the original model in an attempt to make it easier to understand.

shockmodfig/

Figure 1

In a previous post I explained convolution and its use in modelling oil output in the Bakken/Three Forks and Eagle Ford LTO (light tight oil) fields. Briefly, an average hyperbolic well profile (monthly oil output) is combined with the number of new wells completed each month by means of convolution to find a model of LTO output.

Read More