Petroleum Open Thread August 4, 2016

Comments and news about oil and natural gas.

World C+C using EIA data, but substituting the Russian Ministry of Energy Data for Russia shown in the chart below.  The monthly peak was 81, 047 kb/d in Nov 2015.  The centered 12 month running average is also shown with a peak at 80,642 kb/d in Sept 2015.  The annual decline rate since the Nov 2015 peak has been 4.2% per year or about 3.4 Mb/d over a 12 month period if the rate does not change before Nov 2016.  That would imply 77.6 Mb/d by Nov 2016.

Output was 79,784 kb/d in April 2016, I believe the decline rate will decrease by Oct and output will be around 78.5 +/- 0.5 Mb/d in Nov 2016, decline will continue into 2017 and the rate of decline may reach zero some time in 2017.

http://www.eia.gov/totalenergy/data/monthly/index.cfm

http://minenergo.gov.ru/en/activity/statistic

Worldcc/

The Energy Transition

by Dennis Coyne

(note that an Open Thread has recently been published for Petroleum)

I expect World Fossil fuel output to peak in 2025. If the World economy continues to grow in the future, a gap between Energy produced from all sources (including non-fossil fuels) and the demand for Energy will grow over time. If the gap between energy demand and energy supply is not filled by growth in non-fossil fuel energy sources there must be lower demand for energy due to reduced economic growth rates.

ET/

Read More

All Roads Lead To Peak Oil

I follow the JODI World Oil Database primarily because it is now four months ahead of the EIA international data base. I make some adjustments however. I use the OPEC MOMR “secondary sources” for all OPEC data where JODI also uses the MOMR but uses their “direct communication” data instead. The OPEC portion of the JODI data is “crude only” and will therefore be somewhat less than the EIA reports.

I use the Canadian National Energy Base data for Canada instead of the strange numbers JODI has for Canada. And I use the EIA data for the few small producers that JODI does not report.

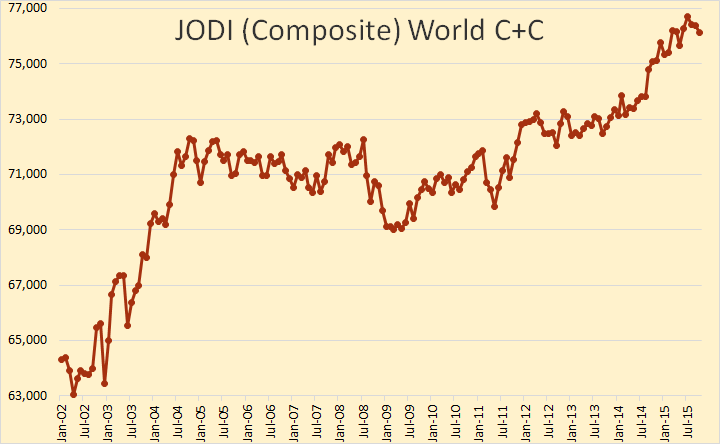
With these Changes I think I have composed an excellent World Oil Database from this composite data. And with the October data just released I have composed the below charts. The data is through October and is in thousand barrels per day.

JODI World C+C

World oil production peaked, so far, in July at 76,702,000 barrels per day and in October stood at 76,128,000 bpd or 574,000 bpd below the peak.

Read More

Worldwide Rig Count Dropping Again

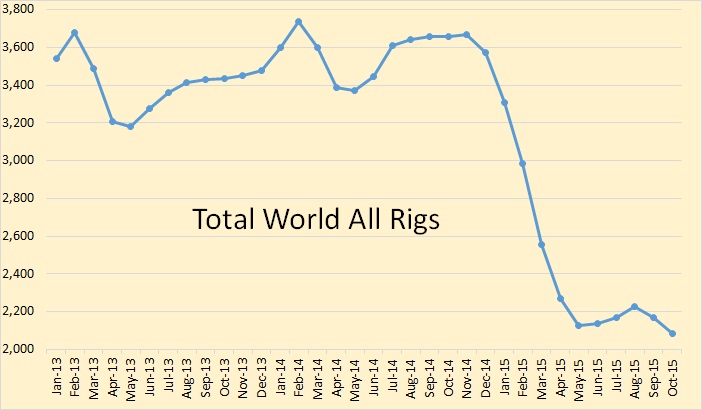
Baker Hughes has published its International Rig Count with production numbers for October. This is a monthly rig count and breaks out the international rigs by oil, gas and miscellaneous. Baker Hughes does not include the Former Soviet Union countries in their count or totals. Baker Hughes also includes the US and Canada in their monthly count but they do not break US and Canada monthly totals out by oil and gas.

BH Total World

All rigs were down 85 rigs in October to 2,086 rigs. October 14 to October 15 total world rigs were down 1,571 rigs of 43%.

Read More