MEXICO Oil Reserves and Production

This is a Guest Post by George Kaplan

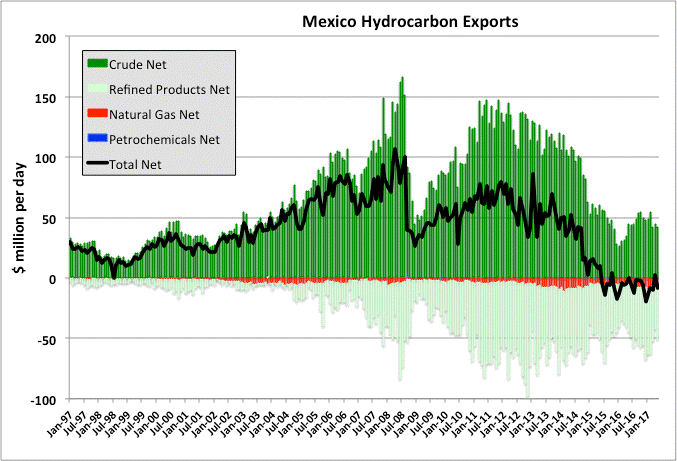
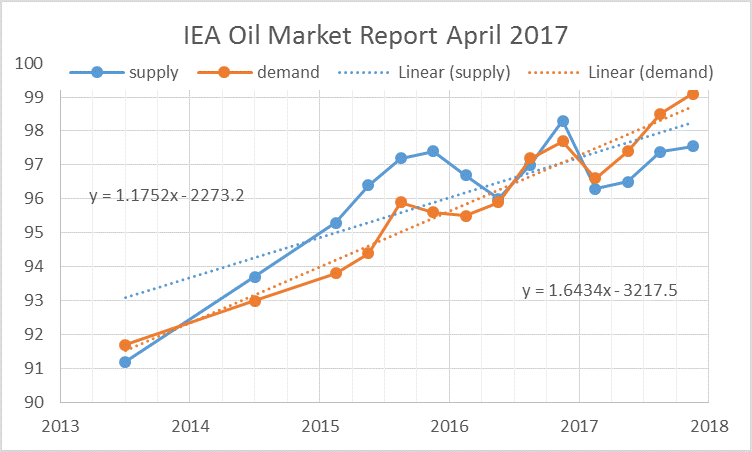
In dollar terms, since mid 2015 Mexico has been a net importer of hydrocarbons (oil, natural gas, petroleum products and petrochemicals combined). To date it has been a relatively small and fairly constant amount, but with their oil production declining, and oil prices apparently continuing to fall while natural gas prices may be on the rise, the net cost could now start to increase.

chart/

Read More

World Energy 2017-2050: Annual Report

A Guest post by:

Dr. Minqi Li, Professor
Department of Economics, University of Utah
E-mail: minqi.li@economics.utah.edu

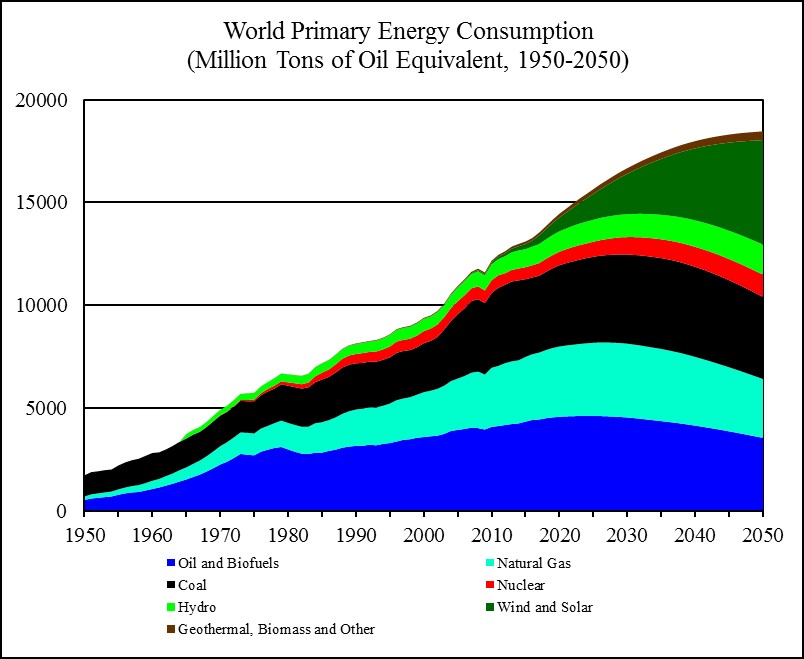
This Annual Report evaluates the future development of world energy supply and its impact on the global economy as well as climate change. The report projects the world energy supply and gross world product (global economic output) from 2017 to 2050. It also projects carbon dioxide emissions from fossil fuels burning and the implied global average surface temperature from 2017 to 2100.

chart/

Figure 18
Sources: World historical oil, natural gas, and coal consumption from 1950 to 1964 is estimated from carbon dioxide emissions (Boden, Marland, and Andres 2017); world primary energy consumption and its composition from 1965 to 2016 is from BP (2017); world primary energy consumption and its composition from 2017 to 2050 is based on this report’s projections. Read More

World Oil Production

A guest post by David Archibald

The views expressed in this post do not necessarily reflect the views of Dennis Coyne or Ron Patterson.

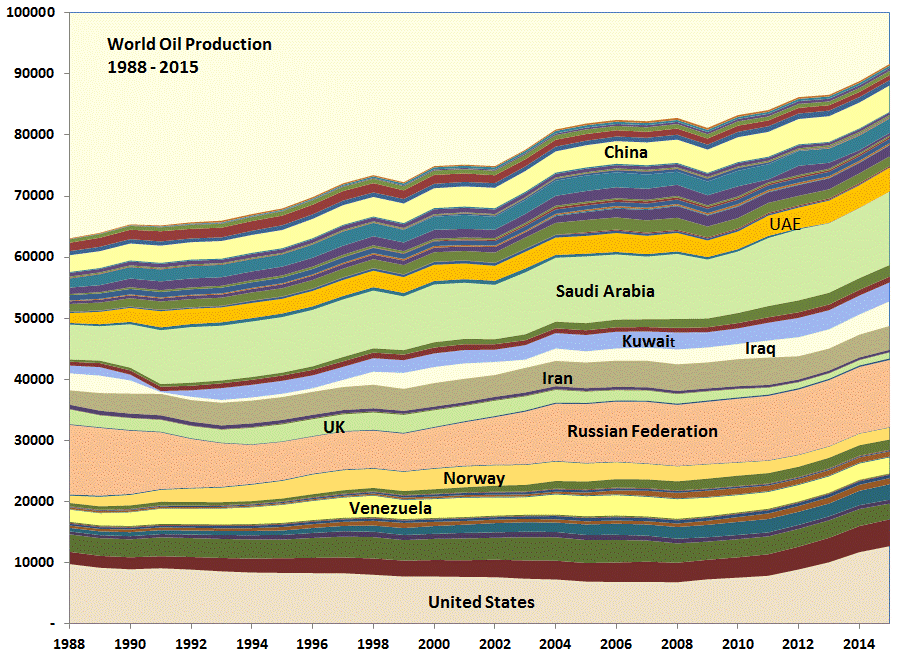
The BP Statistical Review of World Energy has oil production data by country up to the end of 2015. This is what that looks like from 1988:

chart/

The United States increased production by 5.1 million barrels per day from 2010 to 2015. The increase in production from countries around the Persian Gulf over the same period was slightly less at 5.0 million barrels per day. The increase in total world production was 8.4 million barrels per day so the rest of the world declined by some 1.7 million barrels per day. This was despite Canadian production rising 1.0 million barrels per day from oil sands developments plus some other increases from Russia, Brazil, Colombia etc. Most oil producing countries are in well-established long term decline or plateau at best. How these trends will interact can approached from a bottom-up basis. To that end, the following graphs show likely production profiles by region for the next five years. Read More

THE BLOOD BATH CONTINUES IN THE U.S. MAJOR OIL INDUSTRY

Guest Post by SRSrocco

This post does not necessarily reflect the views of Dennis Coyne or Ron Patterson.

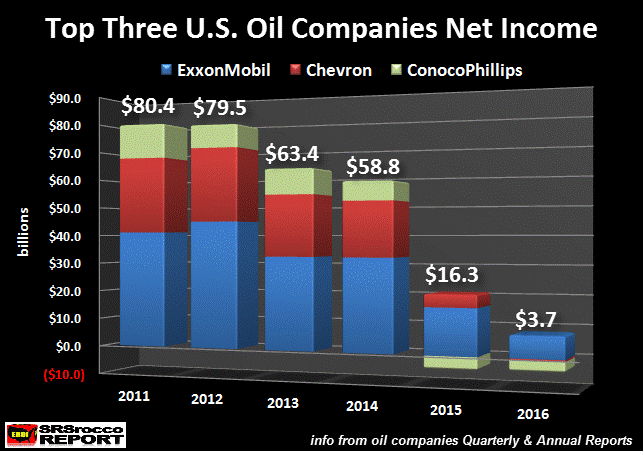
The carnage continues in the U.S. major oil industry as they sink further and further in the RED. The top three U.S. oil companies, whose profits were once the envy of the energy sector, are now forced to borrow money to pay dividends or capital expenditures. The financial situation at ExxonMobil, Chevron and ConocoPhillips has become so dreadful, their total long-term debt surged 25% in just the past year.

Unfortunately, the majority of financial analysts at CNBC, Bloomberg or Fox Business have no clue just how bad the situation will become for the United States as its energy sector continues to disintegrate. While the Federal Government could step in and bail out BIG OIL with printed money, they cannot print barrels of oil.

Watch closely as the Thermodynamic Oil Collapse will start to pick up speed over the next five years.

According to the most recently released financial reports, the top three U.S. oil companies combined net income was the worst ever. The results can be seen in the chart below:
chart/

Read More