February Non-OPEC Oil Production Sinks

A post by Ovi at peakoilbarrel.

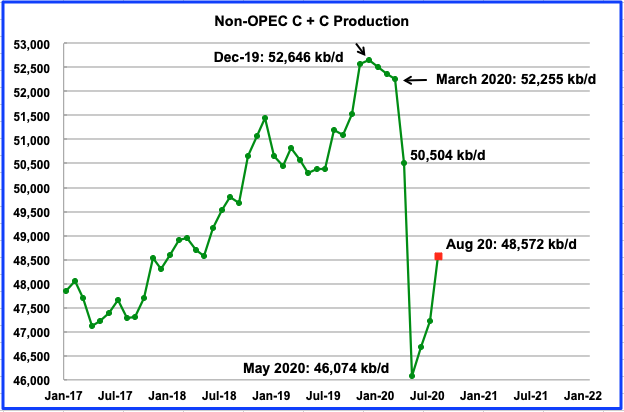
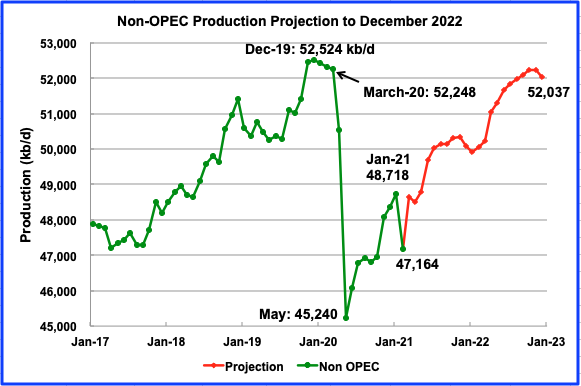
Below are a number of oil (C + C ) production charts for Non-OPEC countries created from data provided by the EIAʼs International Energy Statistics and updated to February 2021. Information from other sources such as OPEC, the STEO and country specific sites such as Russia, Norway and China is used to provide a short term outlook for future output and direction for a few countries and the world.
Read More

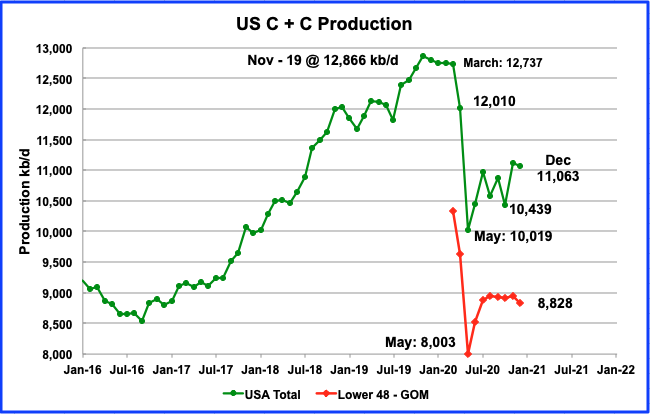
US December Oil Production Drops

A post by Ovi at peakoilbarrel

All of the oil (C + C) production data for the US state charts comes from the EIAʼs Petroleum Supply monthly PSM. After the production charts, an analysis of three EIA monthly reports that project future US production is provided. The charts below are updated to December 2020 for the 10 largest US oil producing states.

Read More

EIA Quarterly Crude + Condensate Production Data

The EIA publishes all kinds of energy production data but I collect and chart only Crude + Condensate data. But that comes in three flavors, monthly, quarterly and yearly. I decided to chart the quarterly data and see if that looks any clearer than the monthly data.

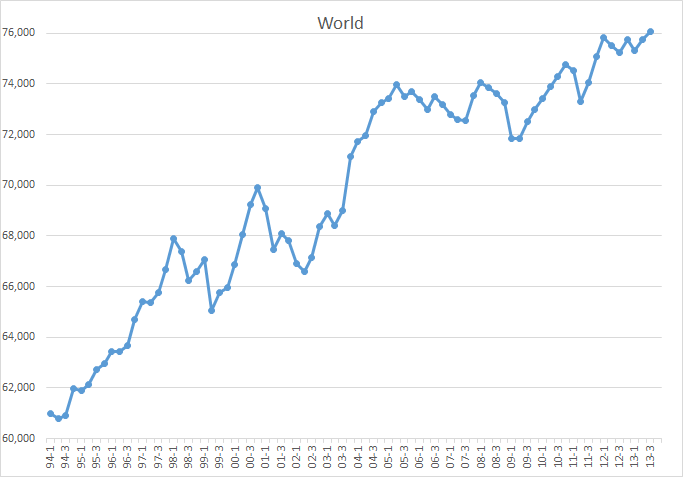
Quarterly C+C production in kb/d. The last quarter, 3rd, ends September 2013.

World

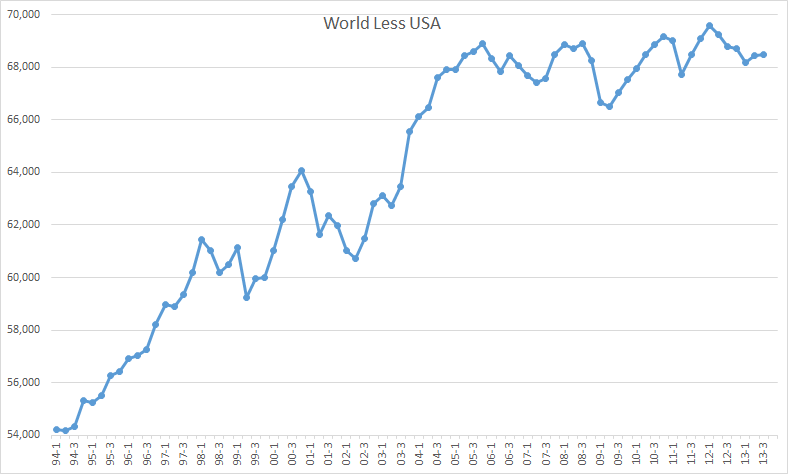
World C+C production has increased 2 million barrels per day since the 2nd quarter of 05. Who were the big gainers that caused this 2 million barrel per day increase?

World Less USA

Turns out it was all USA.
Read More