Taking a closer look at OPEC. All OPEC and price data below is through December. All production data is in thousand barrels per day.
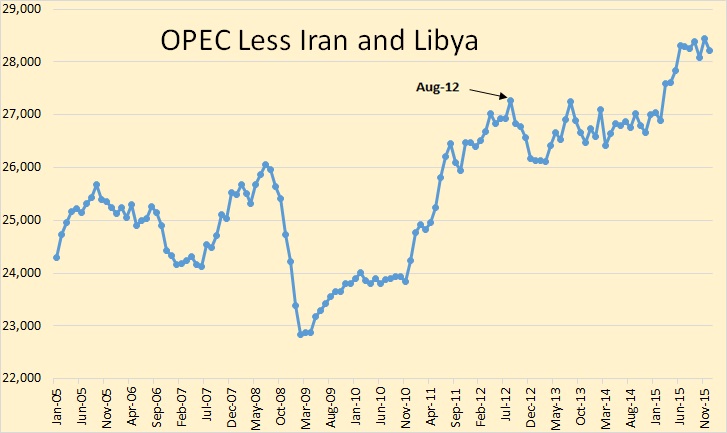
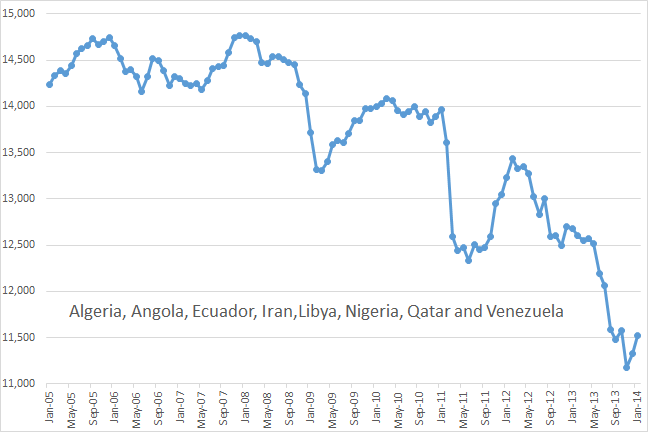
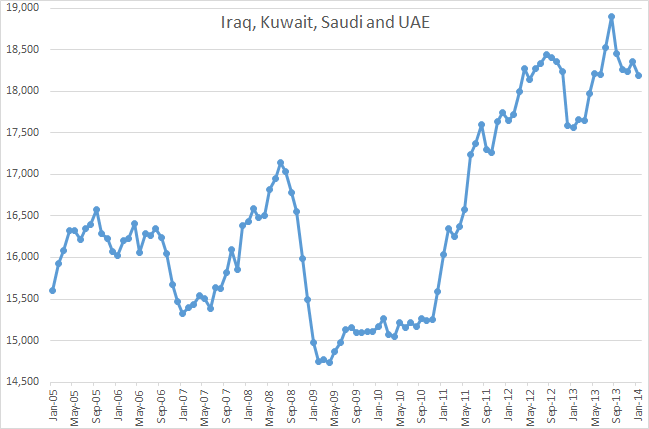
Iran and Libya have had serious political disruptions in their production numbers. Simply adding them to the OPEC numbers distorts the picture. To try to figure out what has been happening to OPEC we need to look at OPEC without Iran and Libya.

Here is OPEC less Iran and Libya, or the OPEC 10 if you will. I have marked August 2012 as what I call the “Price Peak”. Not the peak in oil prices but the production peak that was brought about by the increase in the price of oil. That price increase began in early 2009 and by March 2011 was well above $100 a barrel. And the price of oil did not drop below $100 a barrel until late August 2014.

