Texas RRC Oil and Gas Report, August Data

The Texas Rail Road Commission just released their oil and gas production report with the August data. As you probably know by now that this data is incomplete. The latest months will all turn down but as more companies report their data, which can be up to two years late, the data will reflect what is actually produced.

There is something strange about the August data however. This is the first time since last November that all four data sets, Crude, Condensate, Gas Well Gas and Casinghead (Associated) gas, are show lower production than the previous month. So keeping in mind that the previous months data was just as incomplete as this months is, the data should, if production is increasing, still show an increase. This month however, it does not.

All oil data is in barrels per day and all Gas data is in MCF per day with the last data point August 2013.

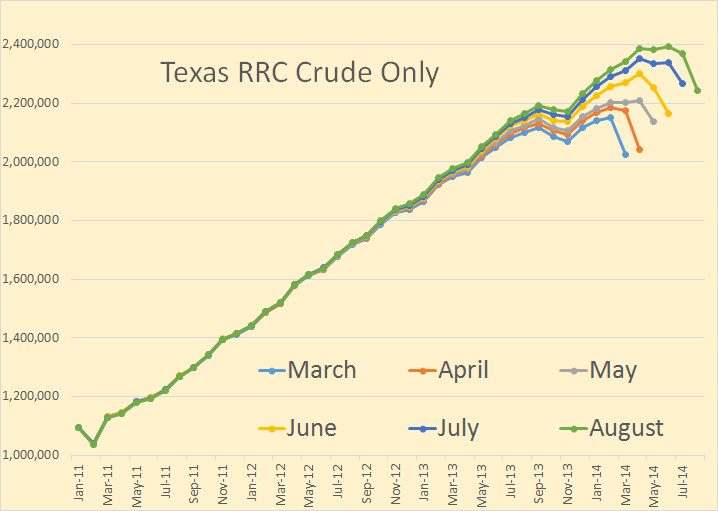
Texas Crude Only

 The August crude only data was 124,723 bpd below July.

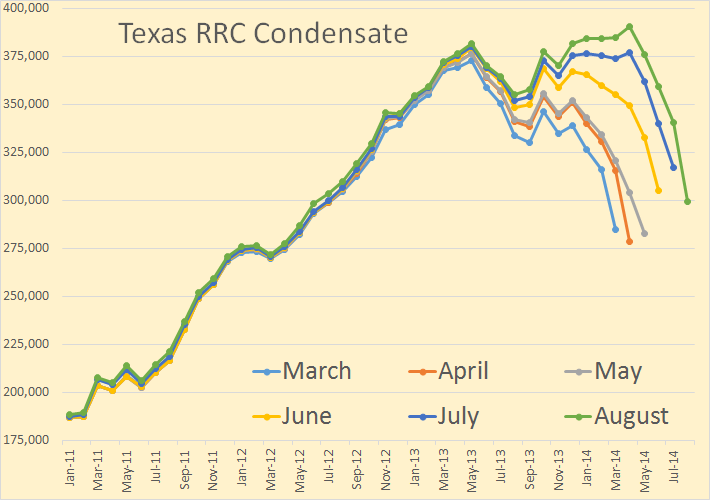
Texas Condensate

Texas Condensate was moving up rather smartly until June of 2013. Since then it has been erratic. It is clear that Texas condensate production is not increasing very much and may now actually be declining. Texas condensate (incomplete data) dropped 41,175 bpd, July to August.
Read More

Texas RRC Report + More About Russia

The Texas RRC Oil and Gas Production Data is out with the June production numbers. I must repeat, as I do every month, that this data is much delayed and is and will be subject to updates every month, for about two years. Of course the latest months will be the ones which will be subject to the greatest revisions.

All oil data is in barrels per day. The last data point on all charts is June 2014.

Texas Crude Only

I have six months of data here to give you some idea of the revisions that can be expected in the coming months. Texas crude only is still increasing. My guess is that it is increasing by about 40 thousand barrels per month.

Texas Condensate

Texas condensate declined for three months in June, July and August of 2013 but has now started to increase again. I estimate that Texas condensate is currently increasing but only some months. It looks like Texas condensate production in some months is declining but in other months is still increasing by as much as 4 to 6 thousand barrels per month.
Read More

Texas RRC Report April Production Data

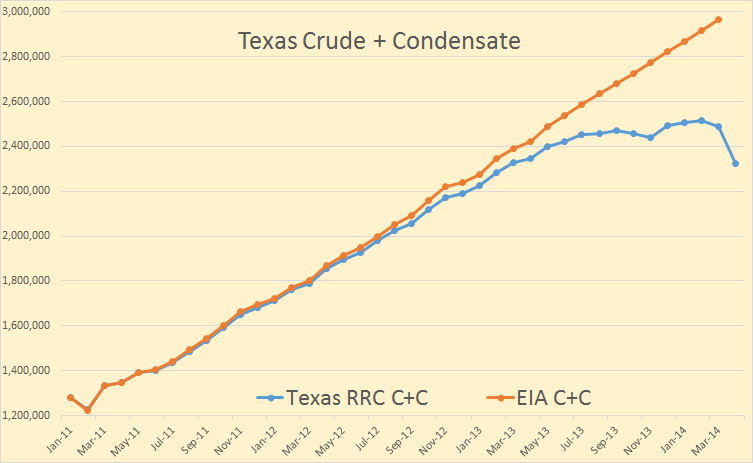
The Texas Rail Road Comission has released their latest report with oil, gas and condensate production for April. The RRC data is always incomplete however and takes many months for the all the data to trickle in. The below chart shows that problem.

Texas RRC-EIA

The data is barrels per data with the EIA data through March and RRC data through April. The EIA has Texas C+C data is highly linear for the 10 months June 2013 through March 2014, increasing at 48 kb/d for 4 months, 41 kb/d for one month then 49 kb/d for the last 5 months.

The EIA has Texas C+C increasing at an average of 48.6 bp/d each month for the last two years. I think that is a little high. I think the production has been increasing at close to 43 kb/d each month but with a recent slow down in that increase.

Texas C+C

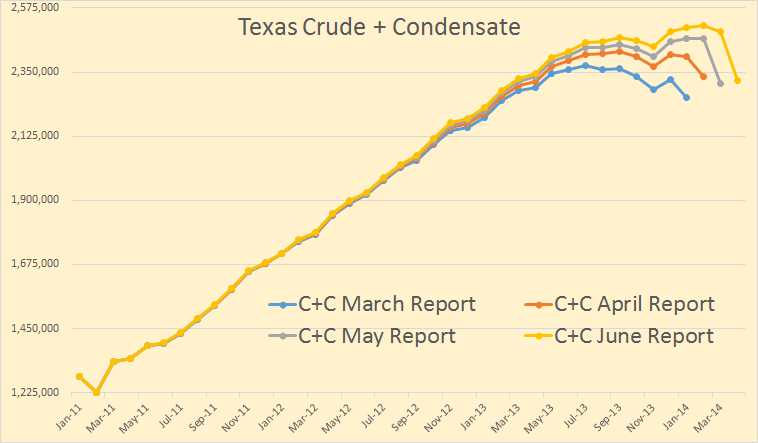
All Texas RRC June report data is through April. The RRC does not combine Crude with Condensate so I have to add the two. But here you can see the problem. Each month the reported data increases with the latest months showing the largest increase. However even if this is the case, the latest month should show an increase almost equal to the final total increase for that month. That was the case in the April Report, (January to February), but not the case for the last two reports.
Read More

Texas RRC Oil and Gas Data

The Texas Rail Road Comission has has released their production numbers for March. The data is always incomplete and the most recent data is always the most incomplete. Nevertheless one can glean quite a bit from the data even though it is incomplete.

Texas Crude Only

The May Report has data through March, April through February and the March report has data through January. You can see from this chart how Texas upgrades their data as data comes trickling in.

Texas Condensate

I looks like Texas condensate has peaked. May 2013 is the peak so far. October 2013 is creeping up but I don’t think it will overtake May. Regardless of whether May will be the ultimate peak or not there is no doubt that there has been a dramatic slowdown in Texas Condensate production.

Read More

Texas RRC Crude and Condensate Data, Is Eagle Ford Peaking?

This page Texas Oil and Gas Production was last updated on February 18. However the data on this page has been updated. And the January production has been updated also: Oil and Gas Production Data Query then check “Lease”, “Both”, Statewide and then punch in the appropriate dates. Then when the next page comes up click on “Monthly Totals”. This brings up the updated monthly totals for Crude, Casinghead Gas, Gas Well Gas and Condensate.

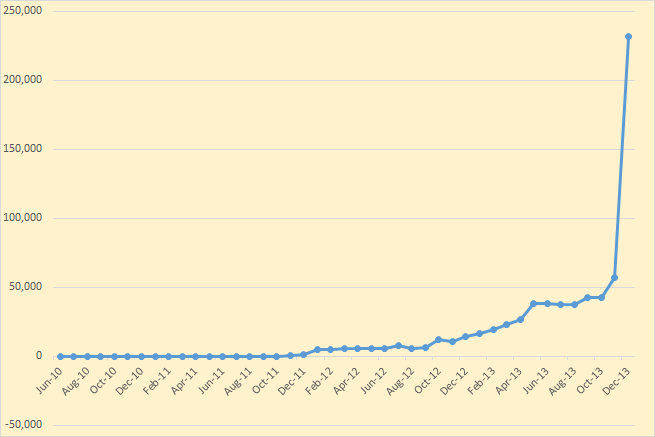
There were revisions going back to July 2010 but only 2013 had any major revisions though there were some 2012 revisions also as the chart below shows.

Texas Revisions

The earlier revisions were smaller and there were some of them that were negative. That is the figures were revised downward.

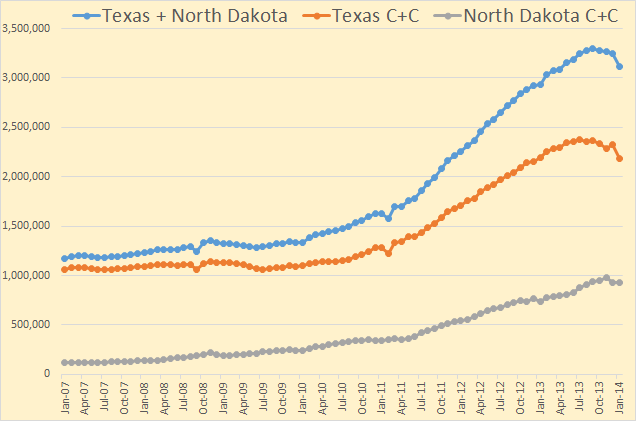
This chart compares Texas with North Dakota. This is all Texas not just Eagle Ford. The last data point for all is January 2014.

Texas + North Dakota

Though there is a lot of conventional production in Texas, the increase is nevertheless about all tight oil. And these two states produce perhaps 95% of all tight oil produced in the United States. And that is about 2  million barrels so far if the Texas RRC is close.

Read More