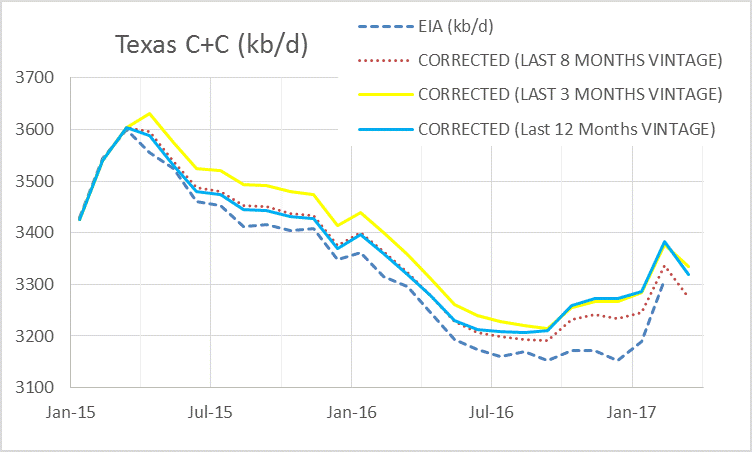
The Chart above compares several different combinations of past (vintage) data to estimate output. The dotted line is based on the most recent 8 months (August 2016 to March 2017) of data saved from the RRC website, the blue solid line is based on the past 12 months of data, and the yellow line is based on the most recent 3 months of data. Read More
Tag: Texas RRC
Permian Basin and Texas Update- April 2017
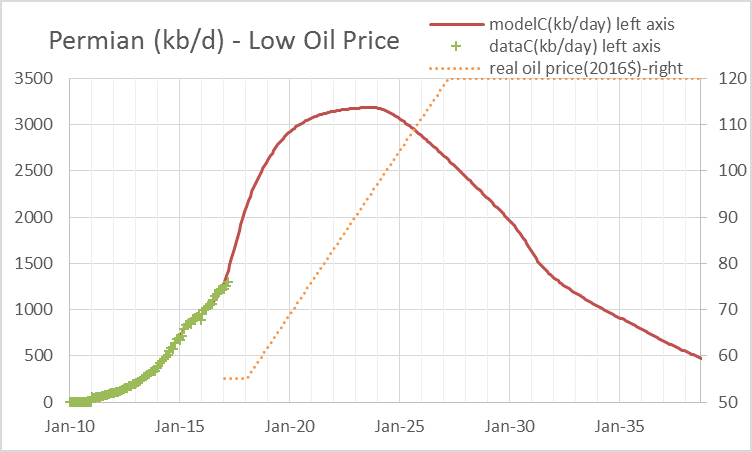
Chart 1 – A Model using data from Enno Peter’s shaleprofile.com.
The chart above (chart 1) needs some explanation. It is based on the Permian LTO model found by using Enno Peters’ data from shaleprofile.com and an estimate of future well completions. I doubt output will rise this quickly, but the peak level may be about right if oil prices follow the assumed scenario. Read More
Texas and Eagle Ford Update April 2017
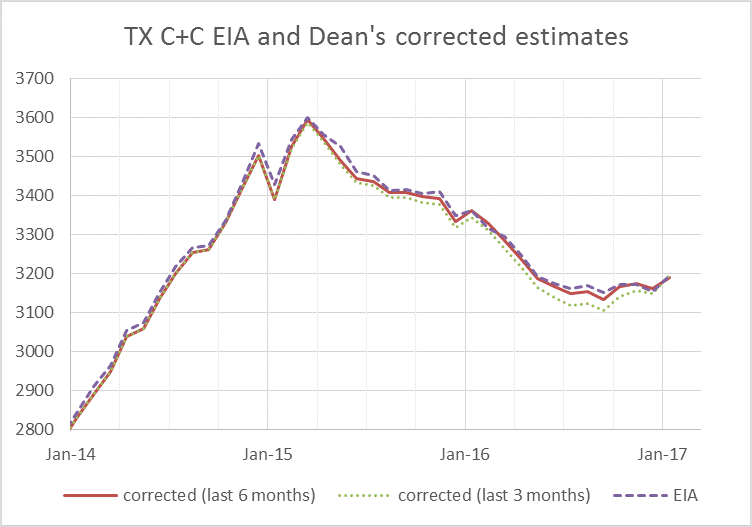
Dean Fantazzini recently updated his estimates for Texas Oil and Natural gas. Data from the Texas Railroad Commission has improved so correction factors are smaller, the estimates from Dean now match the estimates by the US EIA fairly closely for Crude plus condensate (C+C) produced in Texas.
There was a noticeable change in the Texas data about 6 months ago so I show an estimate based on the correction factors from the previous 6 months. Dean prefers to show an estimate based on all the data (which he has done for many months) and an estimate based on the most recent 3 months of data (which has been presented more recently). The EIA estimate is more consistent with the 3 month or 6 month estimate with the “all vintage data” estimate being somewhat higher.
Future US Light Tight Oil (LTO) update
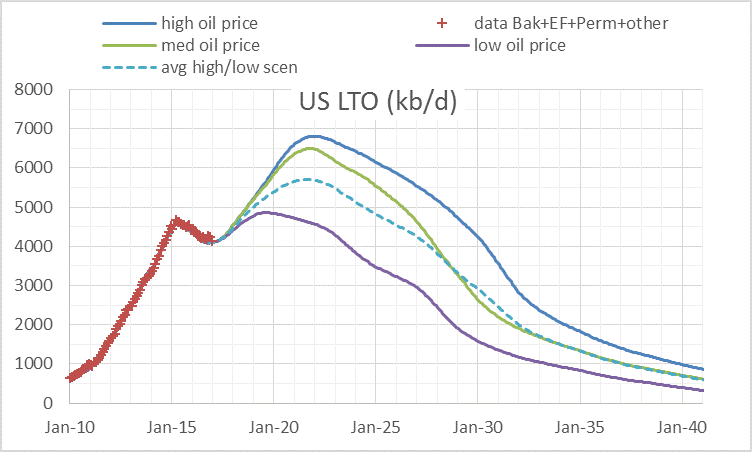
In a previous post on US LTO future output there were suggestions that a bottom up approach might be better than the top down approach and I agree. I will attempt the bottom up approach here. The chart below is a quick summary, based on three different oil price scenarios (high, medium, and low). The dashed line is just the average of the low and high oil price scenarios. Data is from Enno Peters’ website shaleprofile.com and the EIA. (Click on “Tight Oil Production Estimates” for tight oil output data.)
Texas Update- January 2017
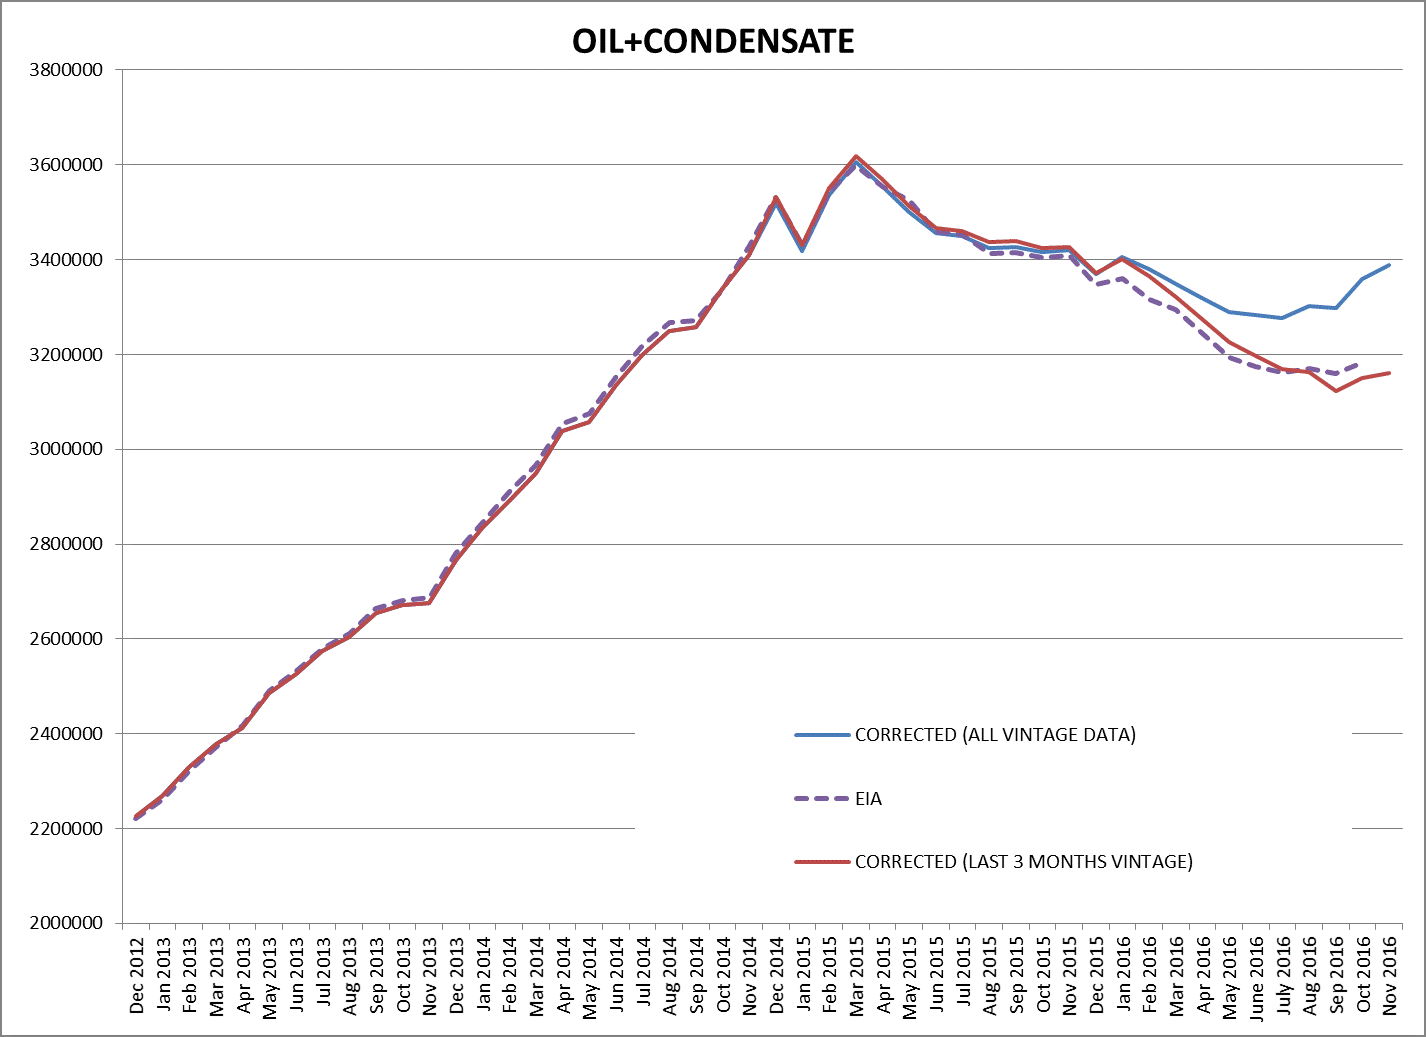
October C+C in Texas was 3151 kb/d and in November it was 3161 kb/d, using the 3 month vintage estimate.
The data from Dean Fantazzini can be found at link below, please credit him if this data is used.
https://www.dropbox.com/s/6mp6sqktz9h33jo/vintage%20November%202016.xlsx?dl=0