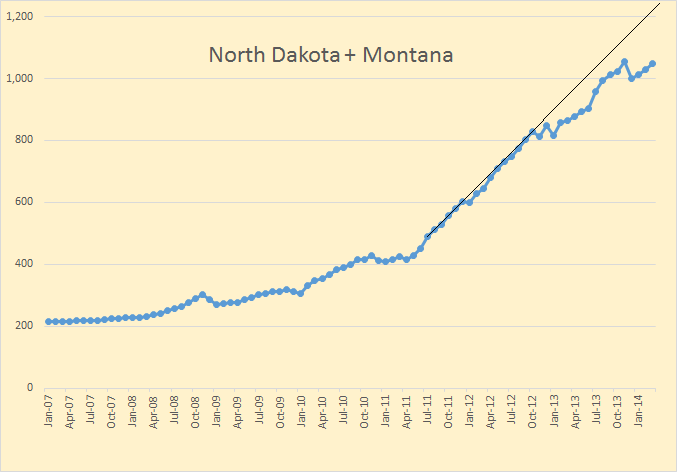
The EIA’s Petroleum Supply Monthly has been published with production data for all individual states and offshore areas. All data is Crude + Condensate and in thousand barrels per day with the last data point March 2014.
Since the Bakken occupies part of two states, North Dakota and Montana, I have combined their production in order to get a better idea of what is really happening there. I have drawn a trend line from July 2011 through October 2012. That shows where production might have been if the fast decline rate and bad weather had not caught up with the. Production was 1,050,000 barrels per day in March, still 5,000 barrels per day below the point reached in November.
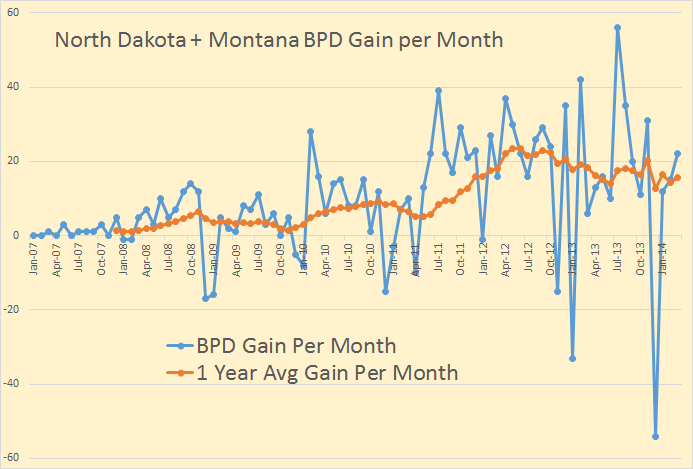
I wanted to show this chart so we could get a better idea what is really going on in the entire Bakken area. Back in May and June of 2012 production was increasing by an average of 23,500 barrels every month. Now production is increasing by an average of 15,580 barrels per month.
Read More

