The EIA Short Term Energy Outlook (STEO) was published recently. A summary in chart form.
The EIA Short Term Energy Outlook (STEO) was published recently. An estimate for World C+C output from November 2024 to December 2026 is presented in the chart below. This estimate is based on crude oil estimates in the STEO for OPEC12 nations, OPEC+ minus OPEC12 nations, and US C+C estimates and the trend in the ratio of the STEO crude estimates and C+C estimates from the EIA’s International Energy Statistics for OPEC12, OPEC+ minus OPEC12, and non-OPEC+ minus US C+C output from November 2018 to October 2024. For the next 4 charts the horizontal and vertical scales are the same, with 9 years on the horizontal axis and 12000 kb/d from the lowest to highest values on the vertical axis so the differences in rates of change are easier to compare. The thin line represents monthly data or forecasts after October 2024 and the markers with labels show the average annual output for each year.
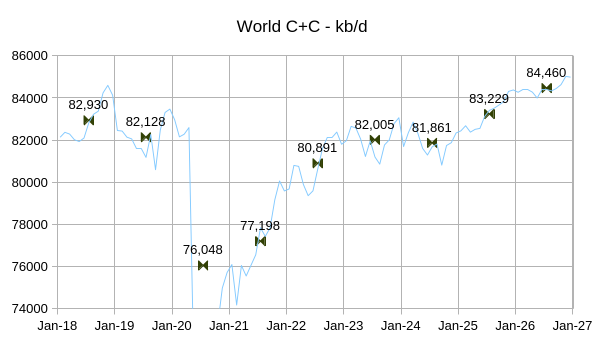
The EIA Short Term Energy Outlook (STEO) was published recently, the estimate for World C+C output from October 2024 to December 2026 in the chart below is based on crude oil estimates in the STEO for World minus US C+C output and the trend in the ratio of the STEO crude estimates and C+C estimates from the EIA’s International Energy Statistics for World minus US C+C output from Jan 2018 to September 2024. For the next 5 charts the horizontal and vertical scales are the same, with 9 years on the horizontal axis and 16000 kb/d from the lowest to highest values on the vertical axis. The thin line represents monthly data or forecasts after September 2024 and the markers with labels show the average annual output for each year.
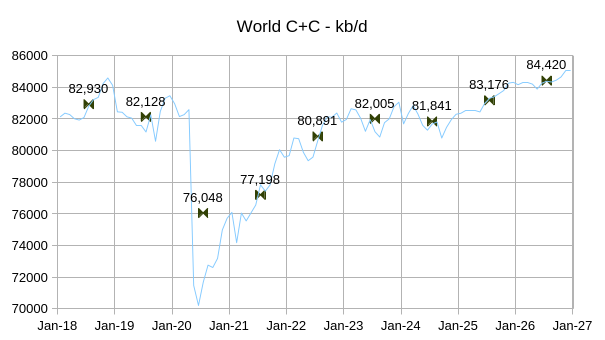
Last month’s estimate for average annual output in 2025 was 83467 kb/d using a similar methodology, so the STEO forecast has been revised lower for 2025, this STEO is the first to forecast through December 2026.
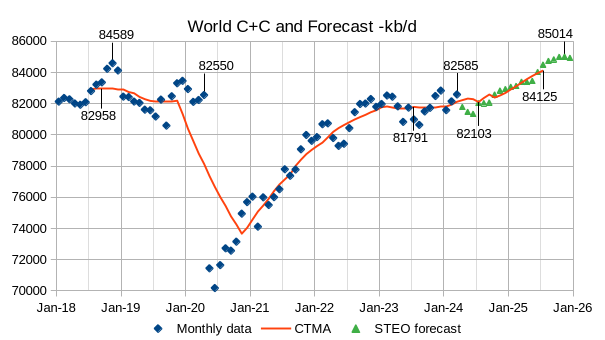
Read MoreThe EIA STEO was published recently, the estimate below is based on data from that report and statistics from the EIA International Energy Statistics. The EIA expects the 2018 peak for annual average World C+C output will be surpassed in 2025. The monthly peak in November 2018 is also expected to be surpassed in November 2025.
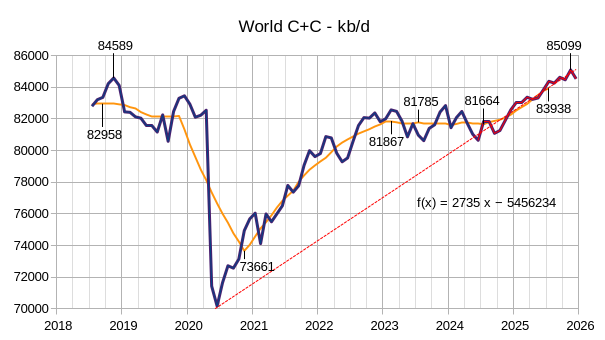
The EIA STEO was published recently the estimate below is based on data from that report and statistics from the EIA International Energy Statistics. The EIA expects the 2018 peak for annual average World C+C output will be surpassed in 2025.