This is a guest post by Political Economist
Nuclear Electricity
According to BP Statistical Review of World Energy 2014, world consumption of nuclear electricity reached 2,489 terawatt-hours (563 million metric tons of oil-equivalent) in 2013, 0.9 percent higher than world consumption of nuclear electricity in 2012. In 2013, nuclear electricity accounted for 4.4 percent of the world primary energy consumption.
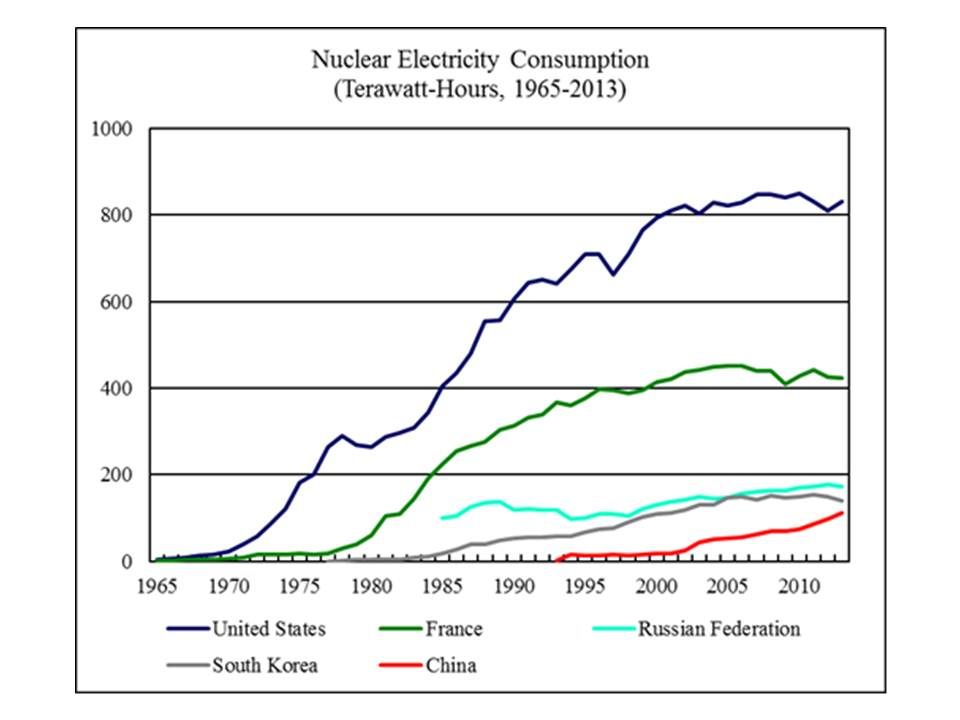
Figure 16 shows nuclear electricity consumption by the world’s five largest nuclear electricity consumers from 1965 to 2013.
 According to the World Nuclear Association, as of January 2014, 375 gigawatts of nuclear electric power plants were operative worldwide. 75 gigawatts were under construction, 187 gigawatts were being planned, and 351 gigawatts were being proposed. World Nuclear Association claims that most planned nuclear power plants are expected to operate within 8-10 years. Assuming that in 10 years, all of the currently constructed and planned nuclear power plants become operative, then in average the world will need to build 26 gigawatts of nuclear power plants a year in the next 10 years. In reality, some delays are inevitable.
I assume that from 2015 to 2050, the world will build 20 gigawatts of nuclear power plants each year. On the other hand, 2 percent of the existing nuclear generating capacity will retire each year. Under these assumptions, nuclear electricity consumption is projected to rise to 4,648 terawatt-hours (1,052 million metric tons of oil-equivalent) by 2050.
Hydro Electricity
According to BP Statistical Review of World Energy 2014, world consumption of hydroelectricity reached 3,782 terawatt-hours (856 million metric tons of oil-equivalent) in 2013, 2.9 percent higher than world consumption of hydroelectricity in 2012. In 2013, hydroelectricity accounted for 6.7 percent of the world primary energy consumption.
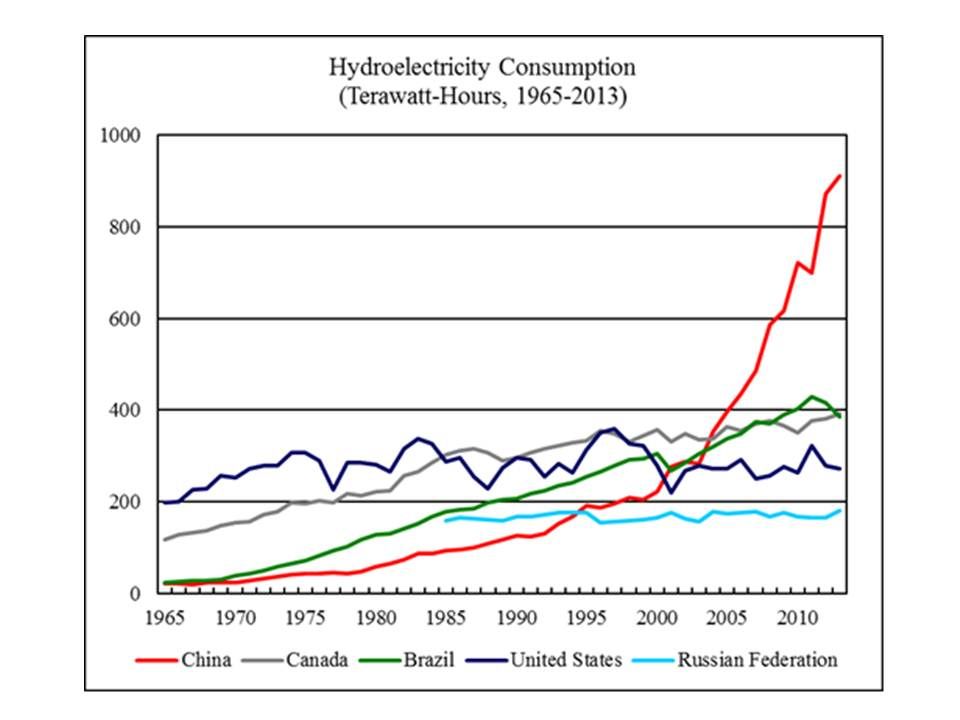
Figure 17 shows hydroelectricity consumption by the world’s five largest consumers of hydroelectricity from 1965 to 2013.
 From 2000 to 2013, the average annual growth of world hydroelectricity consumption was about 90 terawatt-hours (20 million metric tons of oil-equivalent). I assume that world hydroelectricity consumption will rise to 880 million metric tons of oil-equivalent in 2014 and will keep growing by 20 million metric tons of oil-equivalent each year from 2015 to 2050.
Read More
 According to the World Nuclear Association, as of January 2014, 375 gigawatts of nuclear electric power plants were operative worldwide. 75 gigawatts were under construction, 187 gigawatts were being planned, and 351 gigawatts were being proposed. World Nuclear Association claims that most planned nuclear power plants are expected to operate within 8-10 years. Assuming that in 10 years, all of the currently constructed and planned nuclear power plants become operative, then in average the world will need to build 26 gigawatts of nuclear power plants a year in the next 10 years. In reality, some delays are inevitable.
 From 2000 to 2013, the average annual growth of world hydroelectricity consumption was about 90 terawatt-hours (20 million metric tons of oil-equivalent). I assume that world hydroelectricity consumption will rise to 880 million metric tons of oil-equivalent in 2014 and will keep growing by 20 million metric tons of oil-equivalent each year from 2015 to 2050.