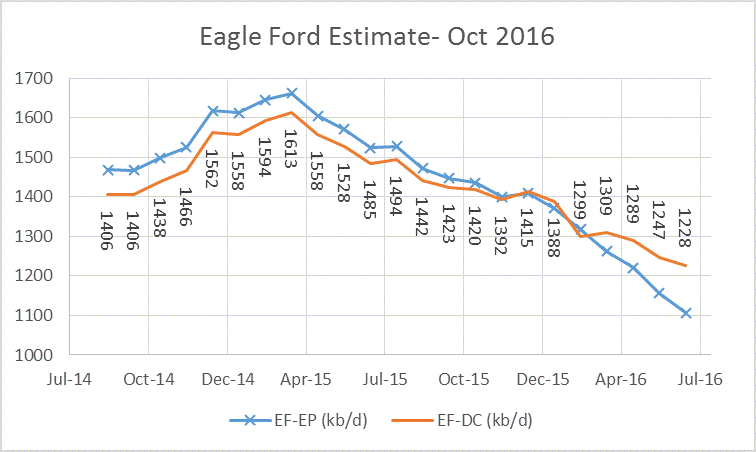
Eagle Ford output is difficult to estimate as there are 20-25 separate fields that need to be followed to get a full picture. To save time, I have used Enno Peters’ data for horizontal wells from Districts 1 to 5 in Texas from his website shaleprofile.com, he has data through June. Enno’s data is combined with the RRC data for statewide C+C output to find the percentage of Texas C+C from the Eagle Ford. This percentage is multiplied by Dean’s estimate for Texas C+C output to get the following estimate, which is compared with Enno Peters’ data. EF-EP is Enno Peter’s collection of data from the RRC, EF-DC is my estimate using the method described. Based on a May 2016 Eagle Ford estimate, I subtract 70 kb/d from the EF-DC estimate to account for non-Eagle Ford horizontal well output in Districts 1 to 5
Tag: shale oil
Mexico, China and Beyond
This is a guest post by David Archibald. The opinions expressed in this post do not necessarily represent those of Dennis Coyne or Ron Patterson
Mexico, China and Beyond
Ron Patterson’s post asking if China’s oil production has peaked reminded me of Mexico
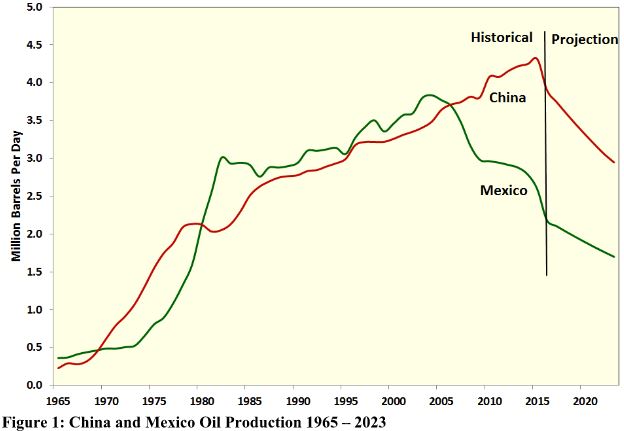
which also produces mainly from supergiant fields. Mexico’s oil production peaked in 2004 and has averaged a 3.5 percent per annum decline rate since, with a peak yearly decline rate of 9 percent in 2008. China’s oil production has fallen 10% from its peak in 2015. Part of that is oil price-related as the Daqing oil field has an operating cost of $46 per barrel and could reverse as the oil price rises. The comparison of China and Mexico with a projection to 2023 is shown in the following figure:
North Dakota Production and STEO
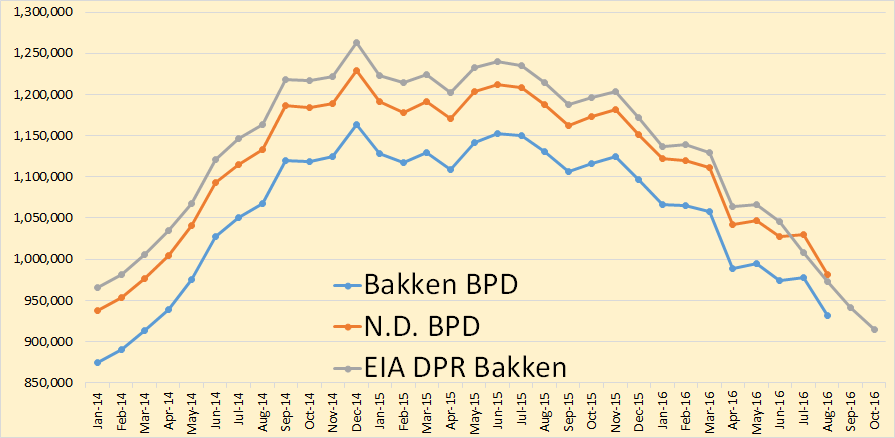
The Bakken and North Dakota production data is out.
Bakken production was up 6,540 barrels per day while all North Dakota production was up 5,383 bpd. This was not posted as a correction to last months data though it looks that is exactly what it is. Last months data was twice as much as it should have been so now it is correct. Notice the data from the Drilling Productivity Report. It appears to have June data exactly correct, or very nearly so. Of course that is all the Bakken, including the Montana Bakken.
North Dakota Oil Production Declining But Slowly
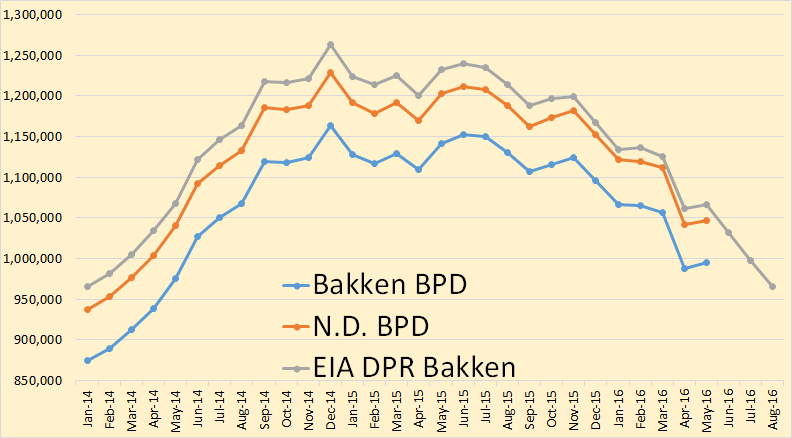
The North Dakota Oil Production Stats are out. North Dakota crude oil production was down just less than 10,000 barrels per day.
Bakken crude oil production was down 7,743 bpd in March while all North Dakota production was down 9,846 barrels per day.
US Oil Rig Count Points To A Sharp Decline In Production
The North American Baker Hughes Rig Count came out Friday. The decline continues. Baker Hughes gives an oil and gas breakout for every basin and state with five years of historical data.
Baker Hughes has twenty eight and one half years of historical data for total US rigs but only five years for individual basins. Gas rigs peaked in August 2008 at 1,606 rigs, over six years before the peak in Oil rigs. On February, 26, gas total US gas rig count stood at 102, a decline of over over 93%.