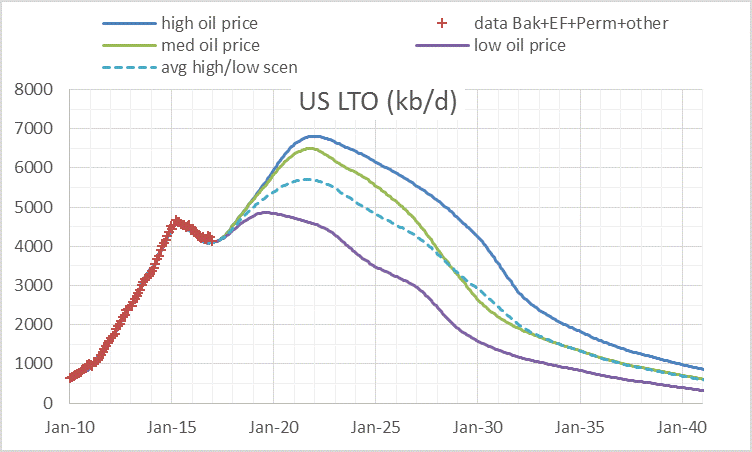
In a previous post on US LTO future output there were suggestions that a bottom up approach might be better than the top down approach and I agree. I will attempt the bottom up approach here. The chart below is a quick summary, based on three different oil price scenarios (high, medium, and low). The dashed line is just the average of the low and high oil price scenarios. Data is from Enno Peters’ website shaleprofile.com and the EIA. (Click on “Tight Oil Production Estimates” for tight oil output data.)
Tag: shale oil
Is The Bakken a Bust?
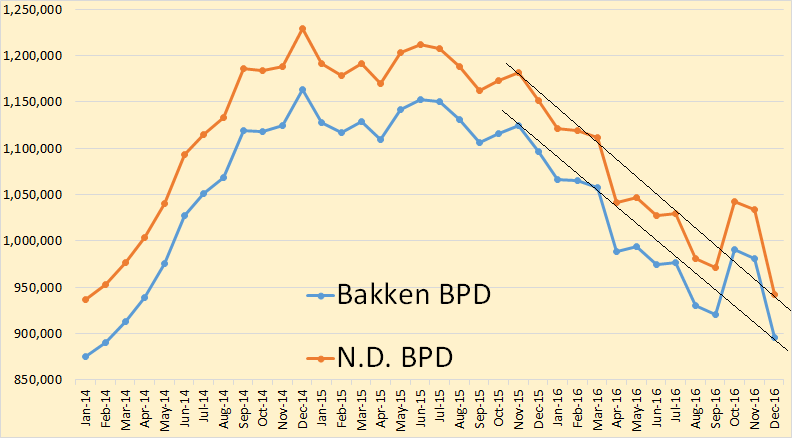
North Dakota has released December production data for the Bakken and for all North Dakota. They were a little shocking.
Bakken production down 86,150 barrels per day 895,330 bpd. North Dakota production down 92,029 bpd to 942,455 bpd. It was noted that this the largest decline ever in North Dakota production. But it should not be overlooked that the October in crease in production was also the largest ever increase in North Dakota production.
Bakken Oil Production Up Over 70,000 BPD
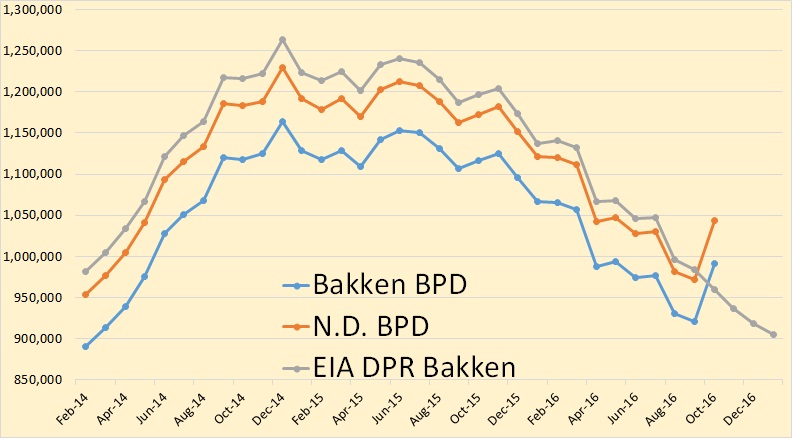
North Dakota just released their production numbers for the Bakken as well as for all North Dakota
The numbers are shocking. The Bakken is up 70,798 bpd to 991,722 bpd and all North Dakota was up 71,447 bpd to 1,043,207 bpd. The EIA’s drilling productivity report really missed the ball on this one.
EIA’s Short-Term Energy Outlook
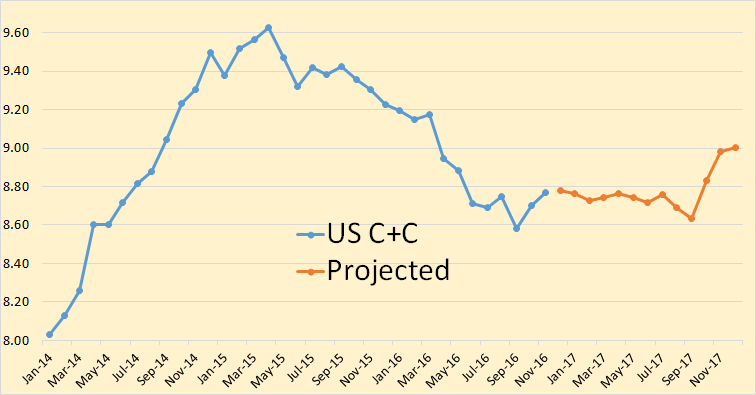
The EIA has just released its Short-Term Energy Outlook. Some of their projections should be taken with a grain of salt because they usually change every month. Nevertheless…
All US production is Crude + Condensate. All other production numbers are total liquids. The data is in million barrels per day.
The EIA has US production leveling out at just under 8.8 million bpd until Oct. 2017.
Bakken Production Down 10 K bpd
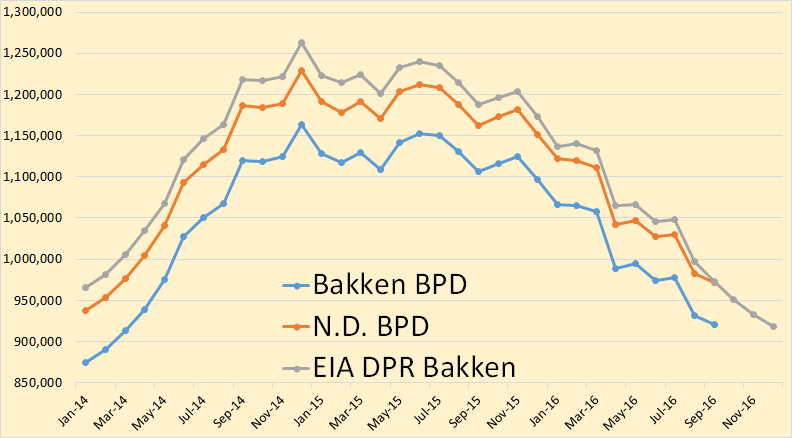
Bakken oil production was down 10,119 barrels per day in September and all North Dakota production was down 10,353 bpd in September.
Bakken production continues to decline though I expect it to level off soon.