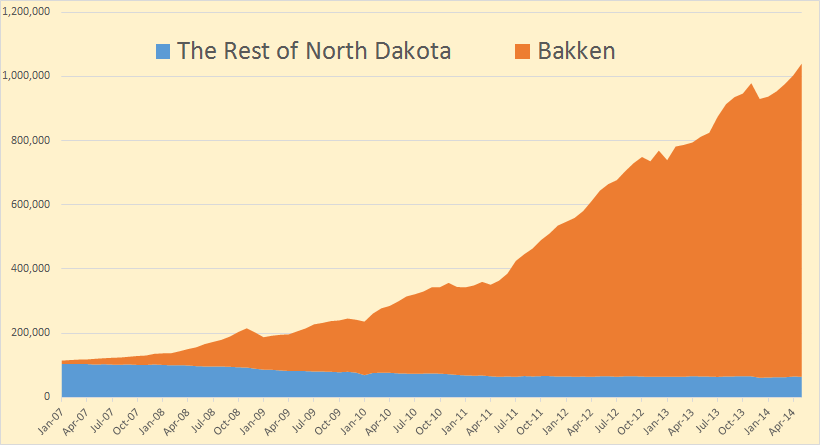
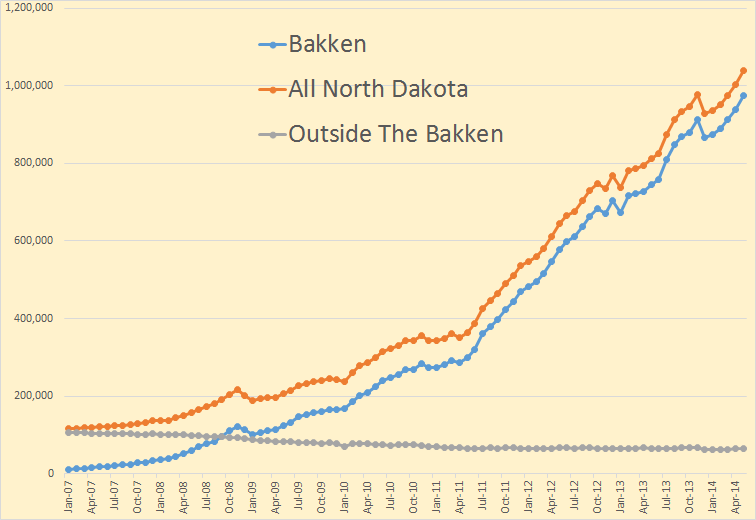
These are indeed good times to be a Peak Oiler. All the peak oil deniers are dancing with wild exuberance, pointing to that spike of US shale oil production that they believe drives the final nail in the “Peak Oil Theory” coffin. And it is all happening right before reality slaps them in the face.
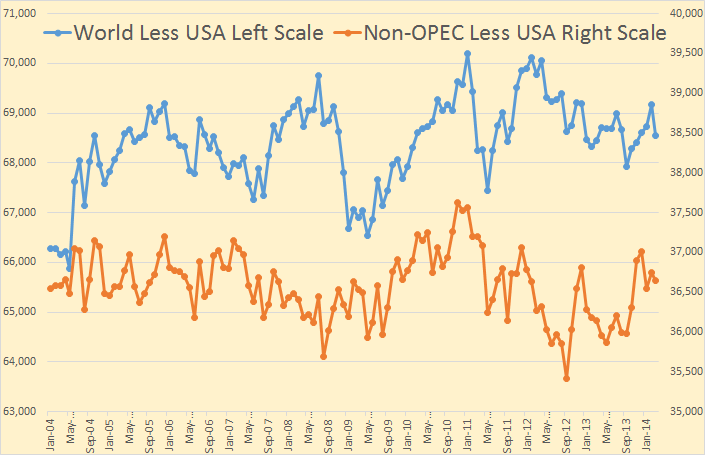
There is no doubt that world Crude + Condensate production, without that tight oil spike, has been on a ten year bumpy plateau.
But, you may ask, when the shale bubble burst, won’t that only mean we will still stay on that bumpy plateau? No for several reasons. First the bursting of the shale bubble will likely cause a decline in US production of perhaps half a million barrels per day per year for three to four years. Second Russia, whose production increase of over 1.5 million barrels per day over the past ten years has kept us on this bumpy plateau, is now in decline.
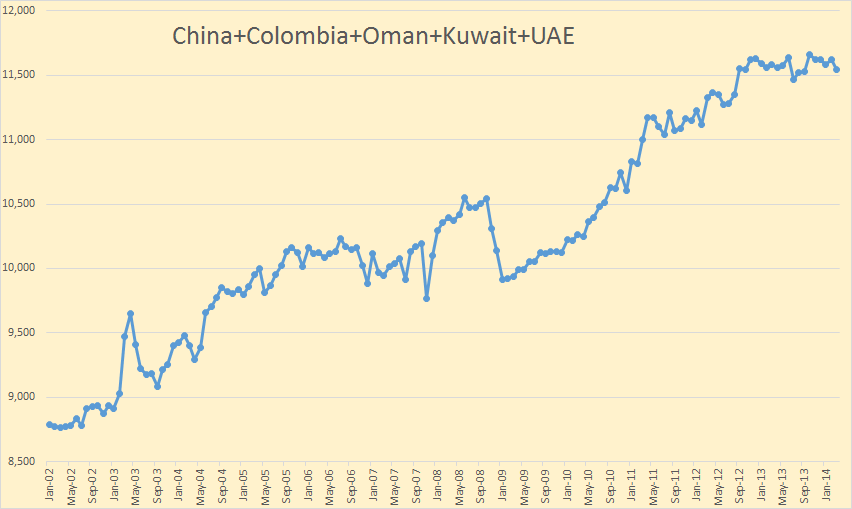
And third, five nations that have shown considerable increase over the past few years now seem to have peaked.
These five nations, who’s 2 million barrel per day increase since mid 2004, have also kept us on that plateau. Their combined production plateaued a year and a half ago. I don’t expect them to decline very fast but they will not add anything to world production in the next few years.
