The EIA’s Petroleum Supply Monthly

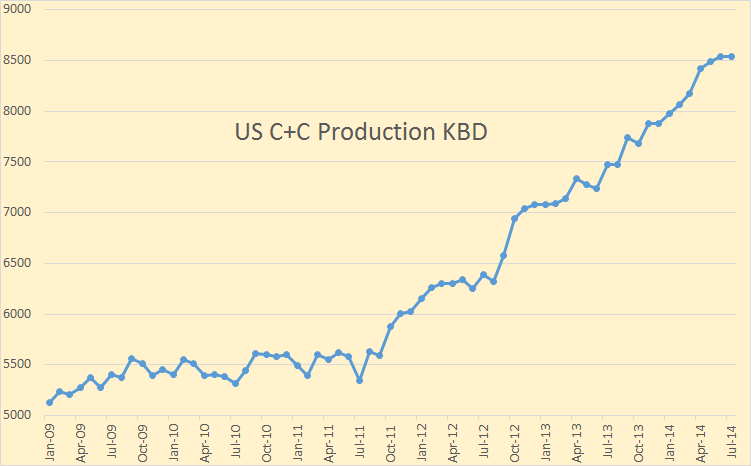
The EIA has just published their Petroleum Supply Monthly with US production, and other data, for July 2014. US C+C production fell by 3,000 barrels per day in July.

US C+C

After a big leap in April things have slowed down considerably in the last three months. US production in July was 8,537,000 barrels per day

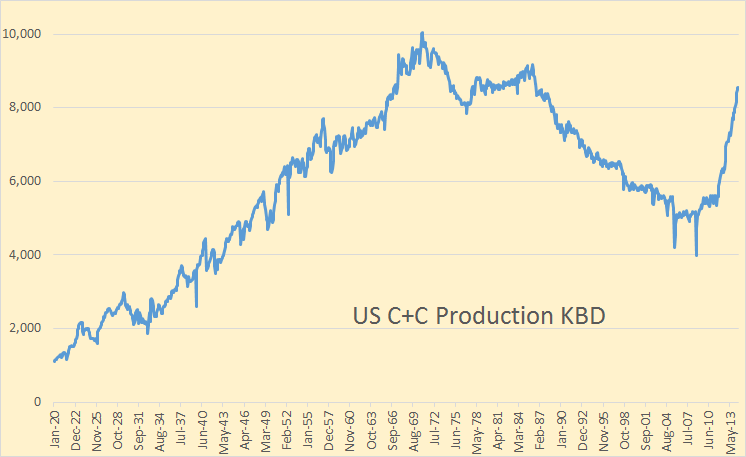
UA Big Picture

This is US production since 1920. We are just over 1.5 million barrels per day below the monthly high of 10,044,000 barrels per day of in November 1970.
Read More

Bakken and N.D. Update for July

North Dakota has released their Bakken and North Dakota production numbers for July.

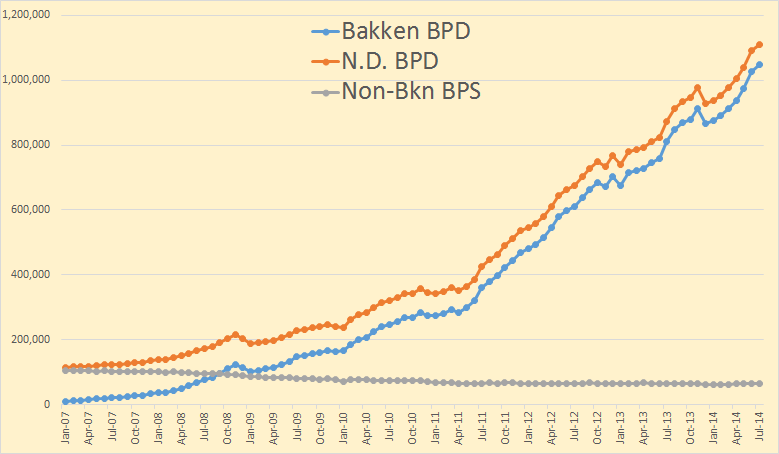
Bakken Barrels Per Day

Bakken production was up 19,456 bpd while all North Dakota production was up 18,134 barrels per day. This means that North Dakota production outside the Bakken fell by 1,322 bpd or a little over 2%.

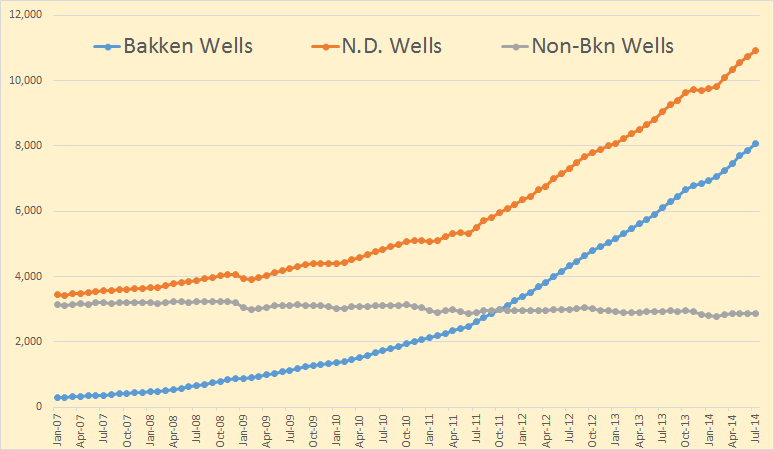
Bakken Wells

Bakken wells producing increased by 195 to 8,065. North Dakota wells increased by the same amount to 10,952 so non-Bakken wells were unchanged at 2,860.

Read More

Who’s Got Liquids? plus Further to the Bakken

This is another Guest Post by David Archibald

Who’s Got Liquids?

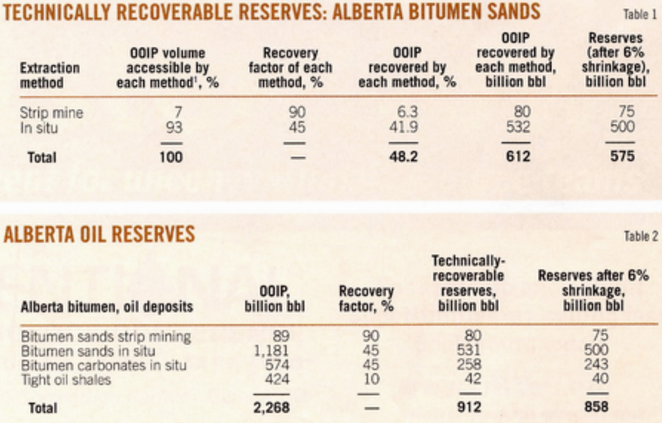
An article by Canadian consultant Mike Priaro in the 7th July, 2014 edition of Oil andGas Journal, “Grosmont carbonate formation increases Alberta’s bitumen reserves”, included the following tables:

David 1

Mr Priaro’s estimate of Canada’s recoverable bitumen is 818 billion barrels. Almost all of that is in Alberta. Combined with their coal resources, Alberta has the biggest fossil fuel resource on the planet. I have updated my estimate of what some of the major countries have in the way of fossil fuels in this table:

David 2

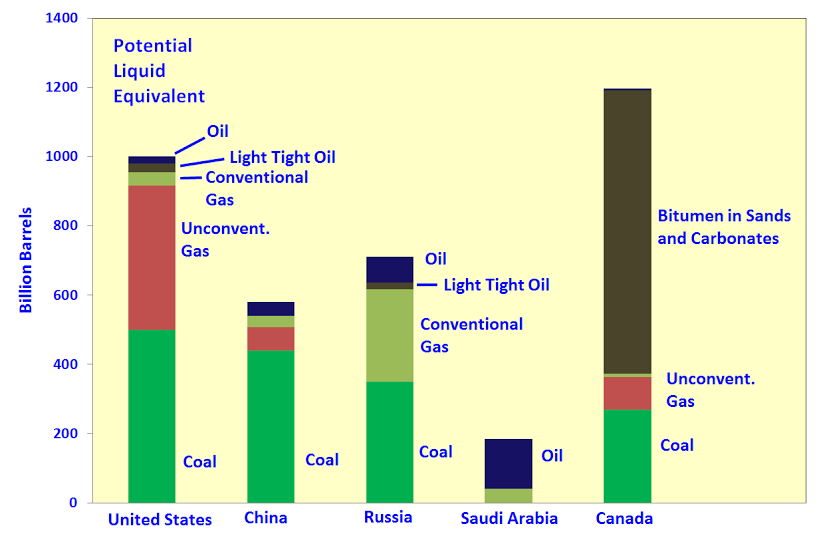
The highest value fuels are those that can be used as liquids in transport. High quality coal produces 2.2 barrels of liquids through a FT plant. In the following graphic I have used a factor of 2x to convert coal to its oil equivalent. Six thousand cubic feet of gas has the energy equivalent of one barrel of oil. Natural gas can be used directlyin some transport applications. Putting it through an FT plant to make diesel, for example, would lose at least 30% of its initial energy. Natural gas has traditionally traded at the oil price in the US and conceivably might return to close to that level in a tight market. So in the following graph, natural gas in TCF is divided by six to produce its oil equivalent in billions of barrels. This is the graph:

David 3

Read More

Global and Russian Energy Outlook to 2040

Like BP, OPEC, the EIA and the IEA Russia also publishes an annual energy outlook. It is called the Global and Russian Energy Outlook to 2040. It is published by The Energy Research Institute of The Russian Academy of Sciences and The Analytical Center for The Government of The Russian Federation. I have no idea who these guys are but their titles sound impressive and they seem to be Russian think tanks funded by the Russian Government. But that is just an assumption of mine.

It is a very large 175 page PDF file that appears to be very scholarly and well researched. However they appear to be very optimistic in their prediction of the future oil supply out to 2040.  In one scenario they are not optimistic at all for coal production however.

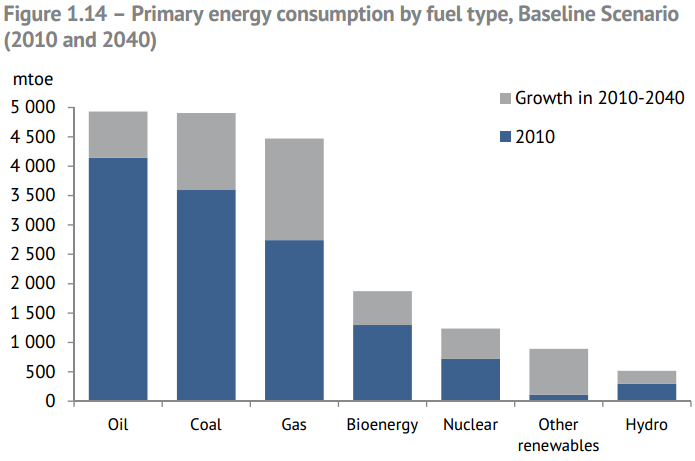
The report has three scenarios, the Baseline Scenario where business as usual continues until 2040. The New Producers Scenario where oil prices collapse due to overproduction and The Other Asia Scenario which is based on peak coal and the effect this will have on China and India. In that scenario they assume China coal production will peak within the next ten years. The Baseline Scenario assumes adequate supplies of coal will be available however. Only in the Other Asian Scenario do they figure in peak coal. All three scenarios assume plenty of oil will be available through 2040.

Russia Take Energy GrowthObviously they don’t see any peak in oil production out to 2040, only growth. However they have coal and gas growing even more. And they seem to be very optimistic about “other” renewables. I don’t know exactly what that might be.

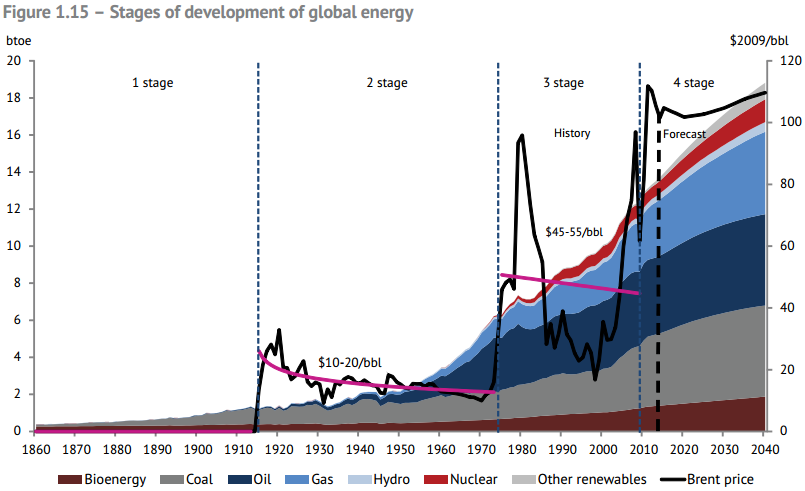
Russia's Take Price

And here is their take with an oil price overlay. It appears they think, because production increases right along with demand, that the oil prices will remain flat.

Read More

Anticipating the Peak of World Oil Production

These are indeed good times to be a Peak Oiler. All the  peak oil deniers are dancing with wild exuberance, pointing to that spike of US shale oil production that they believe drives the final nail in the “Peak Oil Theory” coffin. And it is all happening right before reality slaps them in the face.

There is no doubt that world Crude + Condensate production, without that tight oil spike, has been on a ten year bumpy plateau.

World Less USA A

But, you may ask, when the shale bubble burst, won’t that only mean we will still stay on that bumpy plateau? No for several reasons. First the bursting of the shale bubble will likely cause a decline in US production of perhaps half a million barrels per day per year for three to four years. Second Russia, whose production increase of over 1.5 million barrels per day over the past ten years has kept us on this bumpy plateau, is now in decline.

And third, five nations that have shown considerable increase over the past few years now seem to have peaked.

China et al

These five nations, who’s 2 million barrel per day increase since mid 2004, have also kept us on that plateau. Their combined production plateaued a year and a half ago. I don’t expect them to decline very fast but they will not add anything to world production in the next few years.

Read More