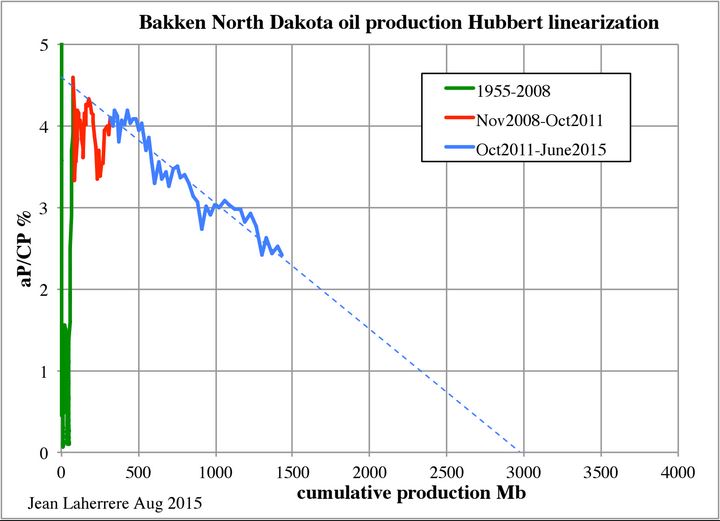
Jean Laherrere sent me the below charts the other day. I had planned on posting them with more Bakken data. But my schedule has been busy so I am posting them alone.
The Hubbert Linearization puts the Bakken about half way to the end.
Jean Laherrere sent me the below charts the other day. I had planned on posting them with more Bakken data. But my schedule has been busy so I am posting them alone.
The Hubbert Linearization puts the Bakken about half way to the end.
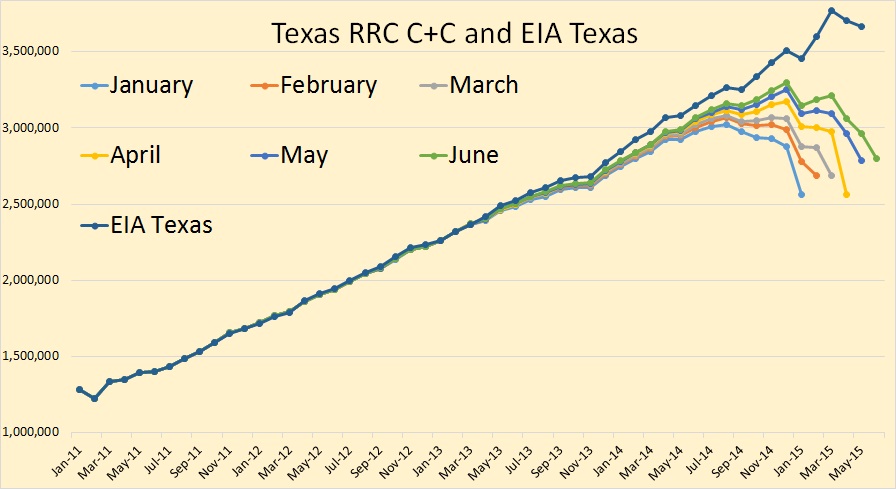
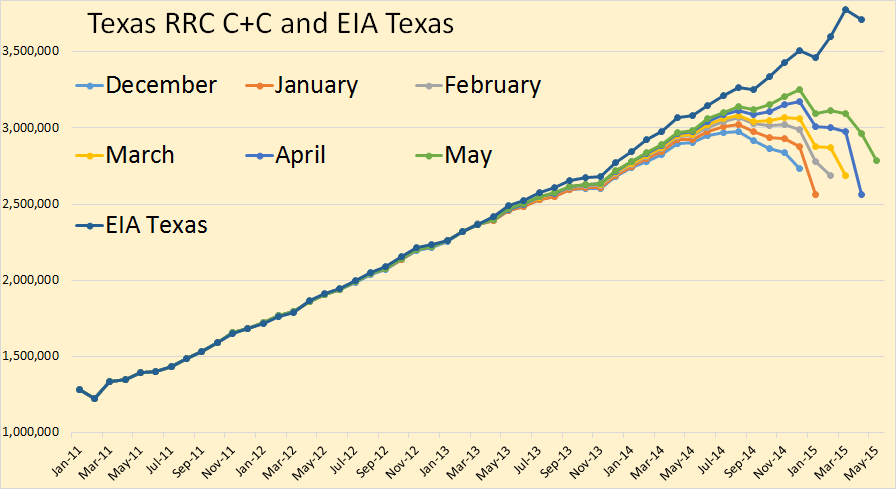
The Texas RRC Oil & Gas Production Estimates are in. By now everyone should know that the Texas oil and gas data is incomplete and the drooping data lines will eventually look more like the EIA lines as the more and more data comes. The EIA data is only through May but all Texas Railroad Commission data is through June.
It appears that Texas C+C was flat to slightly up in June.
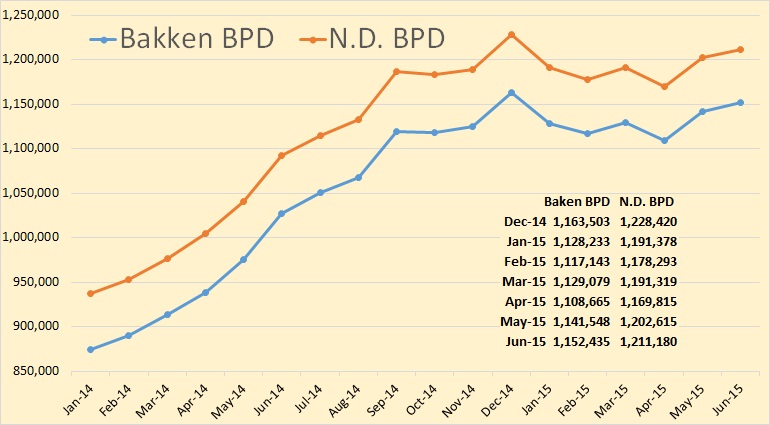
The Bakken Production Statistics and the ND Production Statistics with June production numbers has been published.
Bakken production was up by 10,887 barrels per day to 1,152,455 BPD while all North Dakota production was up by 8,565 barrels per day to 1,211,180 BPD. Bakken production is still 11,068 bpd below their December high while all North Dakota production is still 17,240 bpd below their December high.
The Texas RRC Data is out. All RRC data below is through May. The EIA data is through April.
There appears to be an increase in Texas May crude oil production. You will notice that the EIA has departed from their usual practice of just estimating Texas C+C production up about 50,000 bpd for every month for the last six months or so. They have a new method or estimating Texas production which is explained in the first link below the charts.
Weekly oil shipments by rail can be found on the web at Weekly Carload Reports. And a summation of that data with charts can be found at Association of American Railroads Freight Rail Traffic Data.
Crude oil by rail basically started with the shale boom. Prior to that almost all oil was shipped by pipeline. Of course a lot of oil was trucked to the pipelines. The EIA says in the first seven months of 2014 8 percent of all us crude and refined products was shipped by rail. It looks like that percentage was increased somewhat in the second half of 2014.