Open Thread, Any Energy Related Subject

Data for the below chart is from the Weekly Petroleum Status Report.

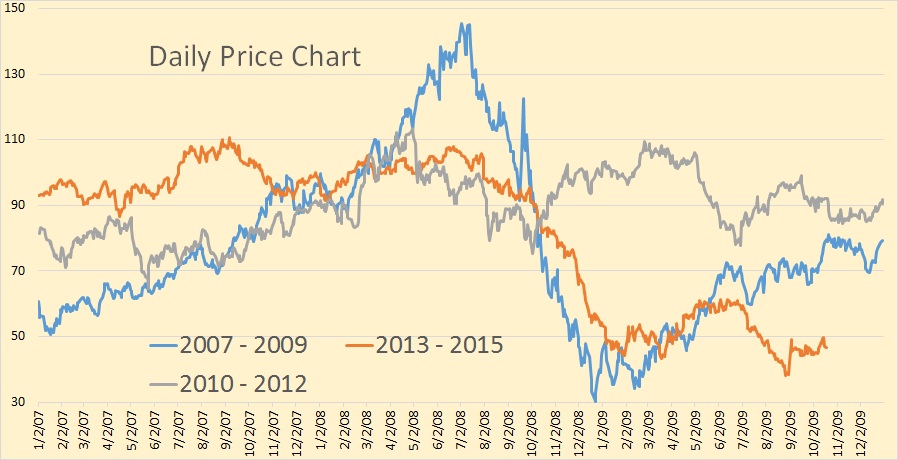
Daily Price Chart

Here we have a three year WTI price comparison chart. You can see that the 2014 price collapse began at almost the exact same time of the year as the 2008 price collapse. The 2008 collapse was a lot more dramatic and fell faster and slightly lower than the 2014 collapse. The 2008 collapse bottomed out around Christmas of that year and the 2014 did not pause until late January 2015. However by late October 2009 the WTI price was already in the $80 range. This time however we are still stuck below $50.

Read More

Open Thread, Oil and Gas

Oil and Gas thread Only. Please post comments on all other subjects on the “Other Subjects” thread below.

Russia oil output at post-Soviet high on foreign projects, Rosneft

Russian oil output, one of the world’s largest, reached a new post-Soviet monthly high of 10.74 million barrels per day (bpd) in September thanks to foreign-led projects and Rosneft, Energy Ministry data showed on Friday.

Output rose from 10.68 million bpd in August and eclipsed the previous record of 10.71 million bpd reached earlier this year, adding to a global glut that has battered oil prices.

This answers a question I have been asking for years, “why is Russian reported production always at least half a million barrels per day higher than EIA or JODI reported Russian production”? Russia is reporting foreign production as if it were produced in Russia! What if the United Kingdom were to do this? Then the BP Alaskan production and much of the production in the Gulf of Mexico would be reported as United Kingdom production. But then the US would get to count all the oil Exxon produces around the world.

Oil Production in Russia to Drop to 310Mln Tons by 2035

Oil production in Russia may fall to 310 million tons from the current 525 million tons by 2035 given a tougher tax regime amid low oil prices and sanctions, according to LUKoil Vice President Leonid Fedun.

That is a 2.6 percent drop per year. That’s what Lukoil is saying will happen if Russia keeps the current tax structure. Of course they are lobbying for a much lower tax rate, saying that is the only way they can have enough money to invest in enough new production to hold production to only a slight decline, down to only 502 million tons a year.
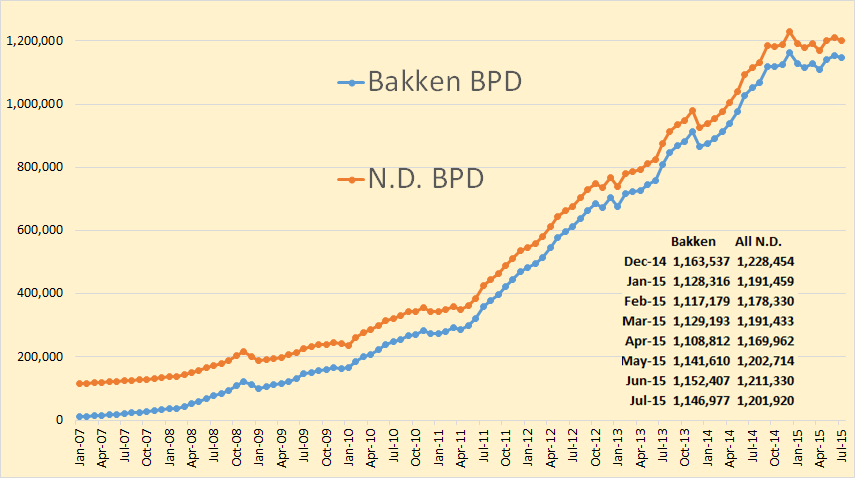
Texas RRC Oil & Gas Production

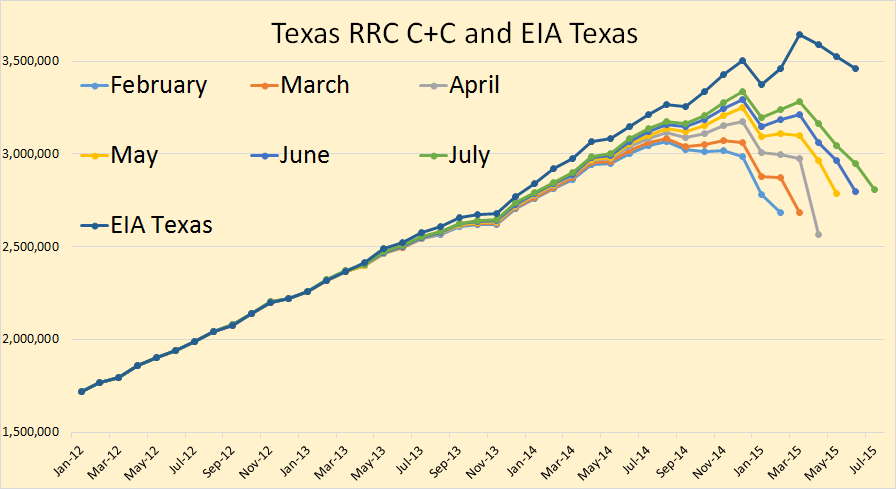
The Texas RRC Oil & Gas Production numbers are out. They came out on a weekend this month. All RRC data is through July. The EIA data is through June. Keep in mind that the RRC data is incomplete, that is why the chart lines droop on the end. However the EIA data is from the EIA’s Petroleum Supply Monthly, the data of which the EIA says now comes directly from the states, and reflects the complete best estimate of oil production.

Texas C+C

According to the EIA data, Texas crude + condensate peaked, so far, in March and declined in April, May and June. However the incomplete data from the RRC shows production likely dropping sharply in April, up in May then flat for June and July.

Read More

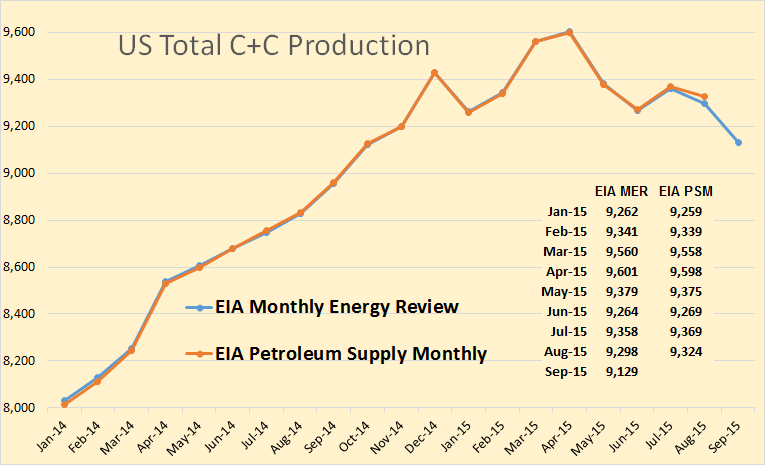
US Oil Production Nears Previous Peak

The EIA’s Monthly Energy Review came out a couple of days ago. The data is in thousand barrels per day and the last data point is July 2015.

Consumption

US consumption of total liquids, or as the EIA calls it, petroleum products supplied, reached 20,000,000 barrels per day for the first time since February of 2008.

Something I never noticed before, consumption started to drop in January 2008, seven months before the price, along with world production, started to drop in August 2008. This had to be a price driven decline. Could the current June and July increase in consumption be price driven also?

Read More