Worldwide Drilling Productivity Report

The EIA publishes what they call a Drilling Productivity Report in which they claim that each rig is getting more productive, that is each rig produces just a little more oil each month than it did the previous month. But over the long haul, I find that the exact opposite is true. In every place in the world, each rig produces a little less oil every year.

Baker Hughes publishes monthly their International Rig Count where we can find the world rig count back to 1975. However I only looked at the last 15 years and found some surprising results.

The last “Rig Count” data point on all charts below is December 2014. Also, very important, the rig count includes rigs drilling for gas as well as oil since Baker Hughes does not break down international rigs down to either gas or oil. They just give us the total rig count.World Rig Count
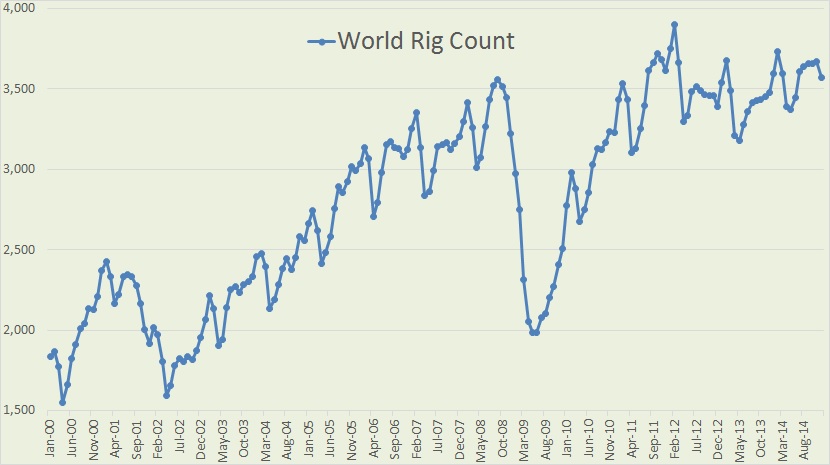
The last price collapse we had, in late 2008, the rig count dropped by over 1,570 between September 2008 and May 2009.US Rig Count
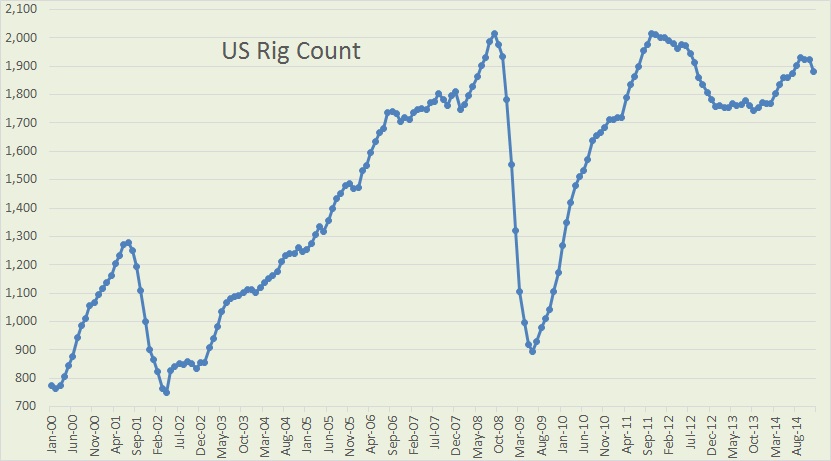
1,114 of that 1,570 rig count decline in 2008 and 2009 came from the US alone. That was the number of rigs dropped by the us between September 2008 and June 2009. Read More
OPEC Crude Oil Production, What’s Next?

The latest OPEC Monthly Oil Market Report is out with OPEC production data for. The data is “Crude Only” and does not reflect condensate production.

Also the charts, except for Libya, are not zero based. I chose to amplify the change rather than the total.

All Data is in thousand barrels per day with the last data point December 2014.

OPEC 12

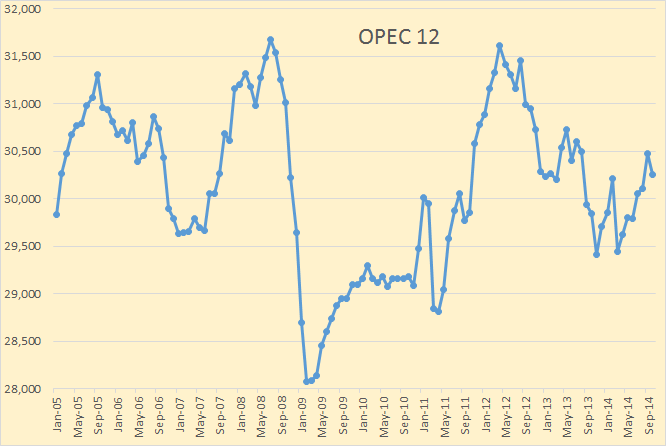
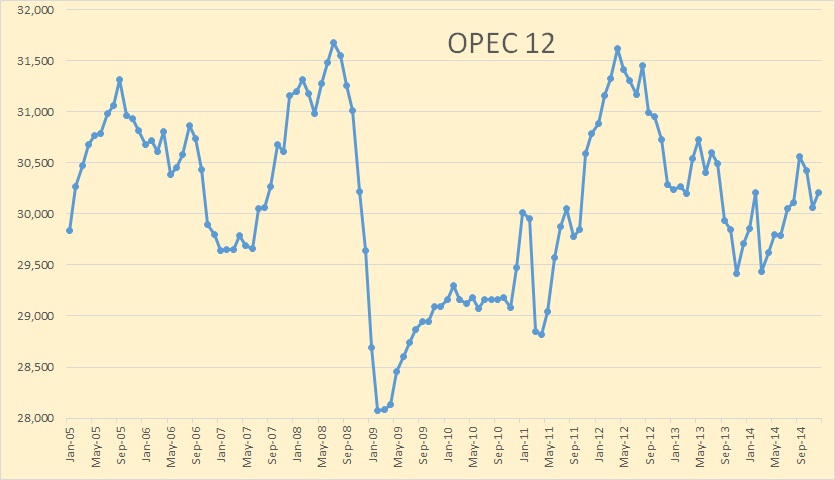
OPEC 12 production has averaged slightly above or below 30 million barrels per day for about two years now and there is little chance it will go anywhere very fast. But what is obvious from the above chart is there has been no surge in OPEC oil production. OPEC’s December production f 30,204,000 barrels per day is still more than 1.4 million barrels per day below the peaks of 2008 and 2012.

Algeria

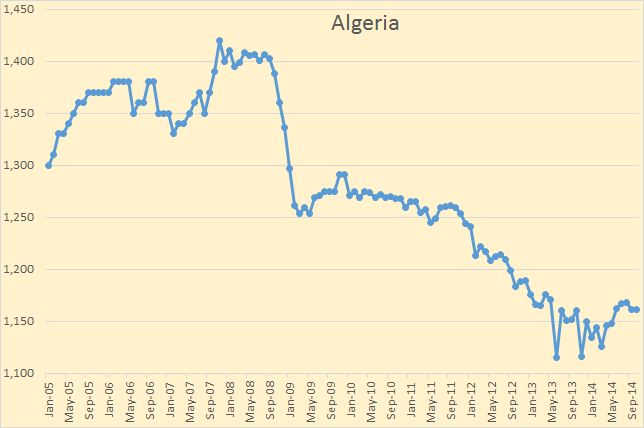
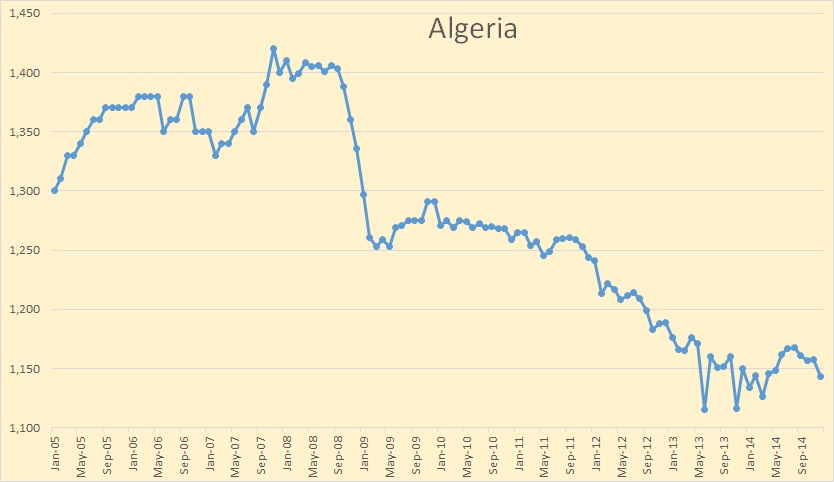
 Algeria is struggling to keep production relatively flat. 

Angola

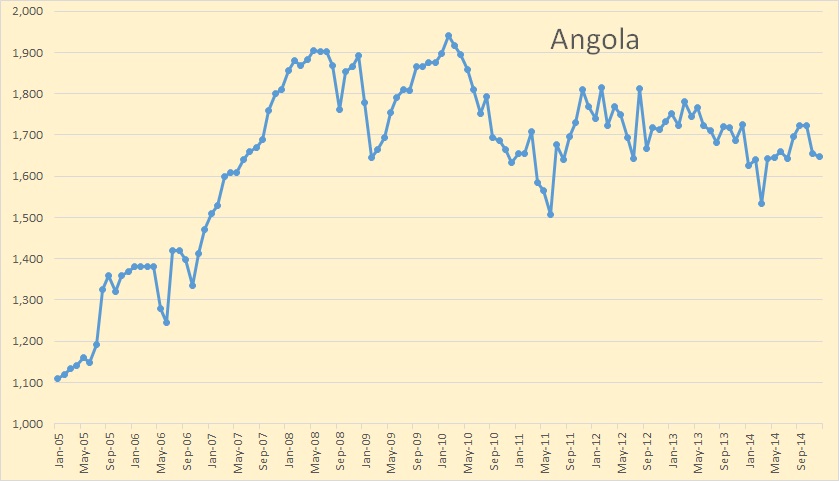
Angola is holding its own… so far.

Read More

OPEC November Crude Production Numbers

OPEC just published its December Monthly Oil Market Report with their crude only production numbers for November.

OPEC Change

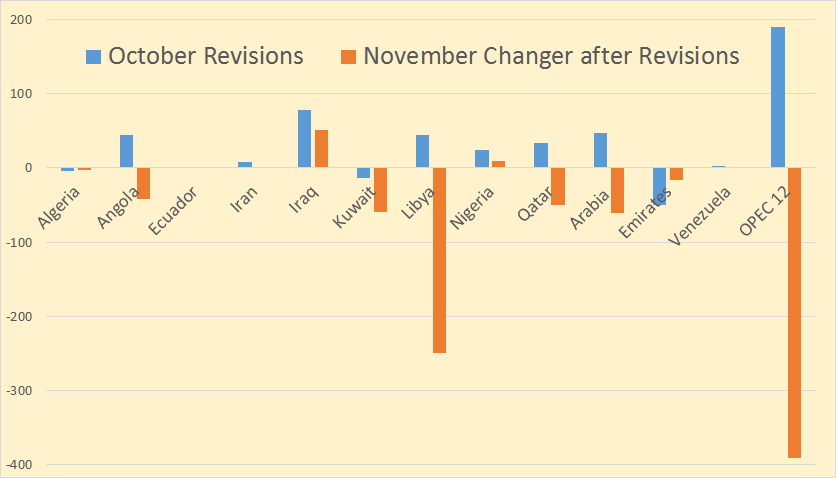
Total OPEC crude only production was down 390,000 barrels per day but that was after October production was revised up by 190,000 bpd. After revisions only Iraq and Nigeria showed any increase in November.

The data for all charts below is in thousand barrels per day and is through November 2014.

OPEC 12

OPEC crude only production stands at 30,053,000 barrels per day.

Read More

OPEC MOMR October Production Data

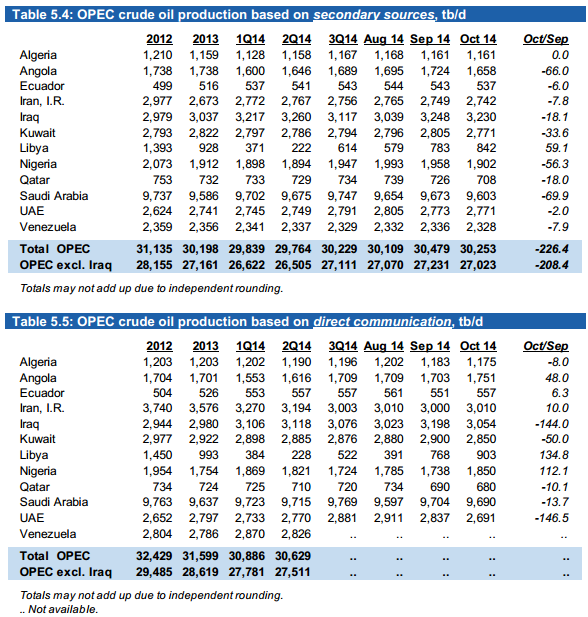
OPEC just published their November Monthly Oil Market Report which contains crude only production data for all OPEC nations. The only big surprise was that everyone had declining production except Libya and Algeria, that is according to “secondary sources”.

OPEC Secondary Sources

I find it interesting that Venezuela has, for the last several months, refused to give OPEC their production data.

All charts below are in the charts below are in thousand barrels per day with the last data point October 2014 and is based on OPEC’s “secondary sources”. I have decided to post all OPEC charts in this post.

OPEC 12

OPEC production declined 226,000 bpd. September production was revised only slightly, up 5,000 bpd.

Algeria

Algeria has stopped their decline, temporally at least.

Read More

World Oil Production According to the EIA

A few days ago the EIA published the latest update to its International Energy Statistics. The data is updated through May 2014. The data on all charts below is through May unless otherwise stated and is in thousand barrels per day. Also, all data is Crude + Condensate.

World

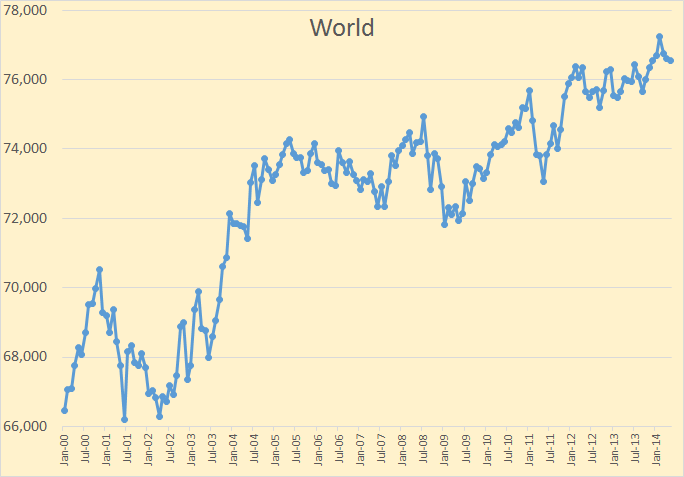
World C+C production was down 72,000 barrels per day in May to 76,540,000 bpd. It was down 708,000 barrels per day since reaching a new all time peak in February of 77,247,000 bpd.

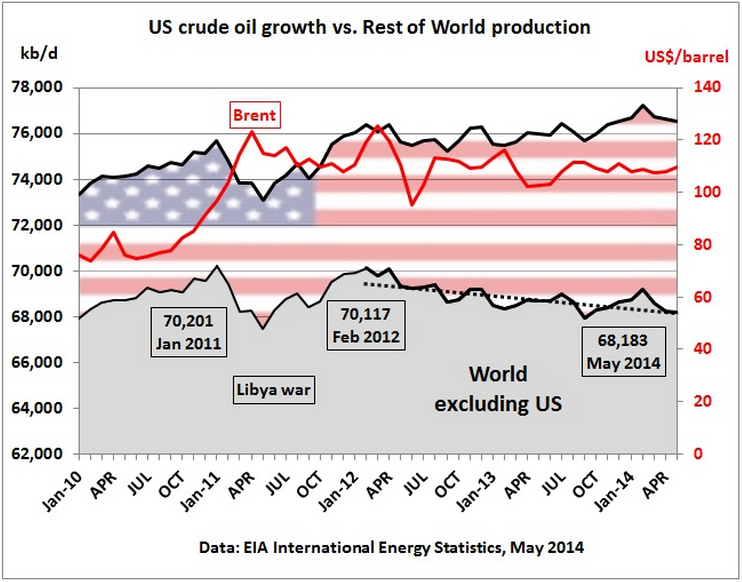
Matt, on his blog Crude Oil Peak, is saying the same thing I have been saying for months. That is US shale oil growth covers up production drop in rest-of-world.

CrudeOilPeak

The trend is clearly down and is going to get worse. Below is my graph using the same data.

Read More