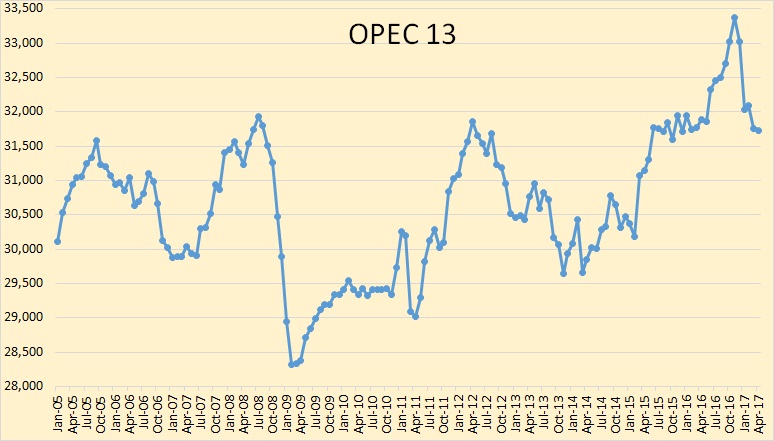
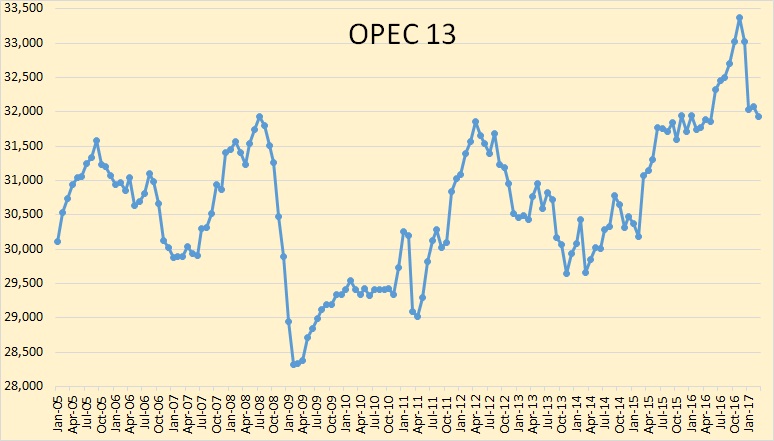
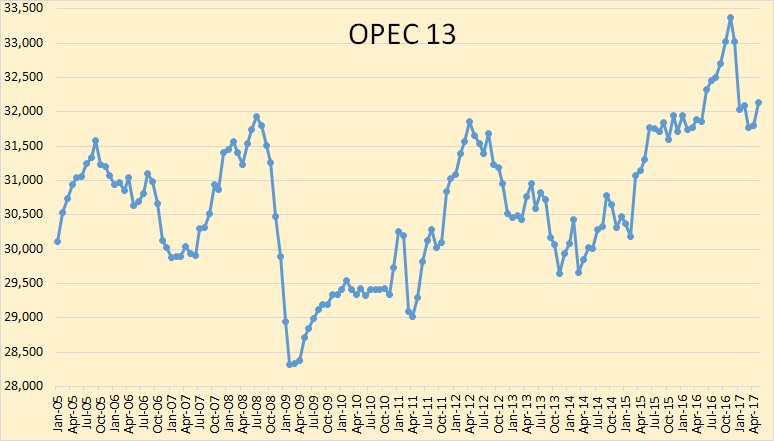
OPEC June Production Data

All data below is based on the latest OPEC Monthly Oil Market Report.

All data is through June 2017 and is in thousand barrels per day.
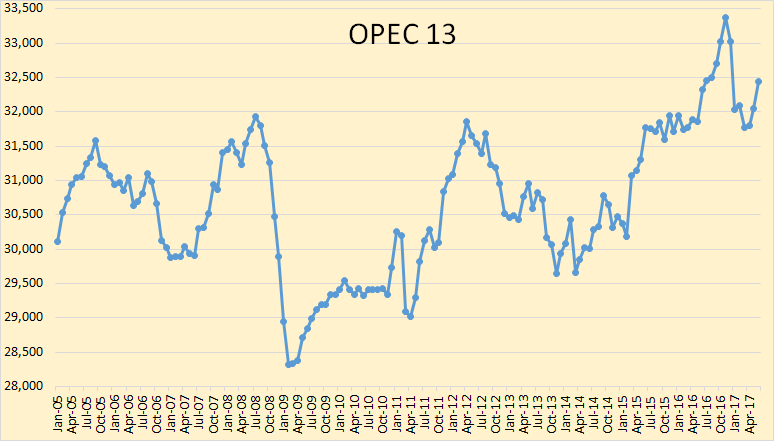
The above chart does not include the 14th member of OPEC that was just added, Equatorial Guinea. I do not have historical data for Equatorial Guinea so I may not add them at all. It doesn’t really matter since they are only a very minor producer. Also, they are in steep decline, dropping at about 10% per year.
Read More

World Energy 2017-2050: Annual Report

A Guest post by:

Dr. Minqi Li, Professor
Department of Economics, University of Utah
E-mail: minqi.li@economics.utah.edu

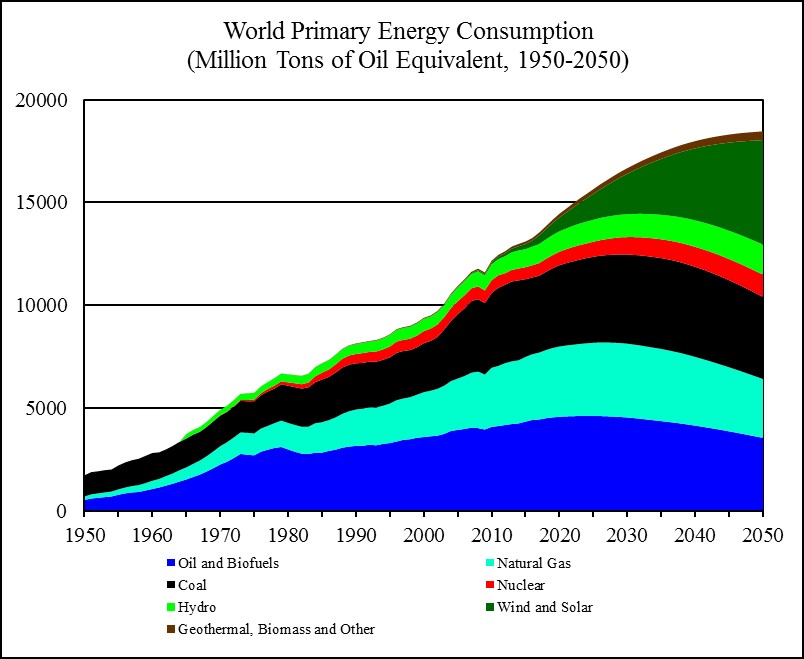
This Annual Report evaluates the future development of world energy supply and its impact on the global economy as well as climate change. The report projects the world energy supply and gross world product (global economic output) from 2017 to 2050. It also projects carbon dioxide emissions from fossil fuels burning and the implied global average surface temperature from 2017 to 2100.

chart/

Figure 18
Sources: World historical oil, natural gas, and coal consumption from 1950 to 1964 is estimated from carbon dioxide emissions (Boden, Marland, and Andres 2017); world primary energy consumption and its composition from 1965 to 2016 is from BP (2017); world primary energy consumption and its composition from 2017 to 2050 is based on this report’s projections. Read More

OPEC May Production Data

All data below is based on the latest OPEC Monthly Oil Market Report.

All data is through May 2017 and is in thousand barrels per day.

OPEC crude only production was up 336,000 barrels per day in May. The two countries that are not subject to OPEC quotas, Nigeria and Libya, were up a combined 352,000 barrels per day. That means the rest of OPEC was down 16,000 bpd. And all this was after OPEC April production was revised upward by 72,000 barrels per day.

Read More

OPEC April Production Data

All data below is based on the latest OPEC Monthly Oil Market Report.

All data is through April 2017 and is in thousand barrels per day.

Looking at the above chart it seems obvious what most OPEC nations were doing. They announced in the summer of 2016 that there would likely be quota cuts beginning in 2017. And those cuts would be a percentage of their current production. So everyone began making heroic attempts to increase production by the end of 2016. So now, after everyone who felt that they should cut, has cut, they are right back to the level that they were at before the cuts were proposed.

I wrote the above paragraph last month. I see no reason to change a word of it now.

Read More

OPEC March Crude Oil Data

The OPEC Monthly Oil Market Report is out with OPEC’s crude oil production numbers for March 2017.

All data is through March 2017 and is in thousand barrels per day.

Looking at the above chart it seems obvious what most OPEC nations were doing. They announced in the summer of 2016 that there would likely be quota cuts beginning in 2017. And those cuts would be a percentage of their current production. So everyone began making heroic attempts to increase production by the end of 2016. So now, after everyone who felt that they should cut, has cut, they are right back to the level that they were at before the cuts were proposed.

Read More