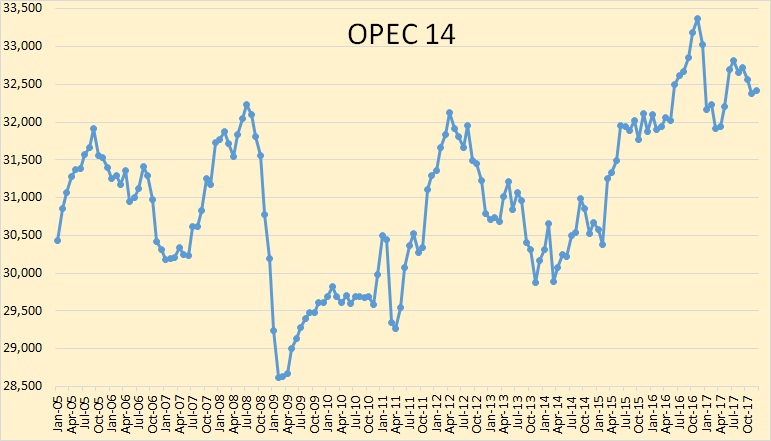
OPEC September Oil Production

All data below is based on the latest OPEC Monthly Oil Market Report.

All data is through September 2017 and is in thousand barrels per day.
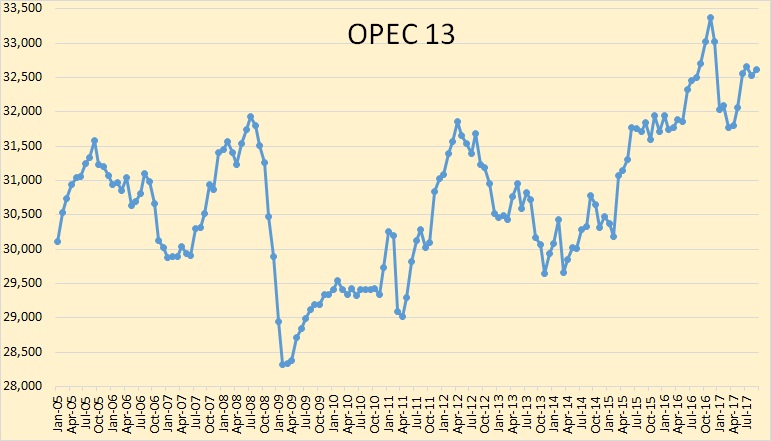
The above chart does not include the 14th member of OPEC that was recently added, Equatorial Guinea. I do not have historical data for Equatorial Guinea so I may not add them at all.  OPEC production has held steady for the past four months. Equatorial Guinea production is tiny, 141,000 bpd so their monthly change in production can be ignored without much effect. OPEC 14 production was up 88,000 barrels per day in September. But that was after their August production had been revised downward by 82,000 bpd.

The OPEC 13, (not including Equatorial Guinea), peaked in 2016 at 32,385 kbpd and are down 150 kbpd for the first 9 months of 2017. Please note that when I say “peaked” I mean “peaked so far“. I am well aware of the fact that OPEC, or some OPEC nations may have further peaks in the future.

Read More
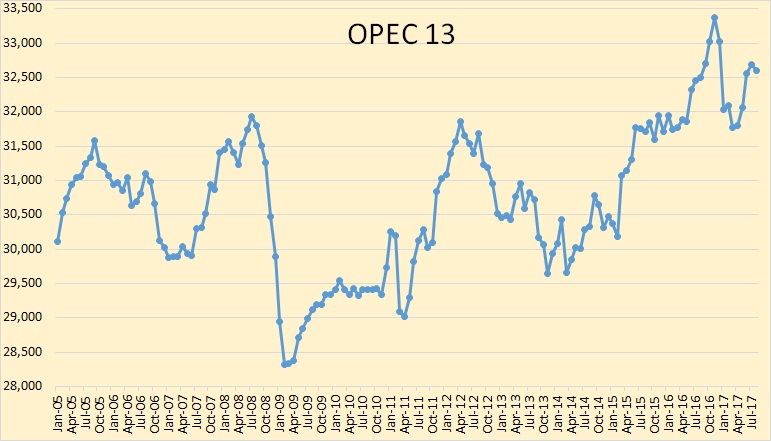
OPEC August Crude Oil Production

All data below is based on the latest OPEC Monthly Oil Market Report.

All data is through August 2017 and is in thousand barrels per day.

The above chart does not include the 14th member of OPEC that was just added, Equatorial Guinea. I do not have historical data for Equatorial Guinea so I may not add them at all.  OPEC production has held steady for the past three months. Their production was down 79,000 barrels per day in August but that is not a big drop when production is over 32.5 million barrels per day.

Read More

World Oil Production

A guest post by David Archibald

The views expressed in this post do not necessarily reflect the views of Dennis Coyne or Ron Patterson.

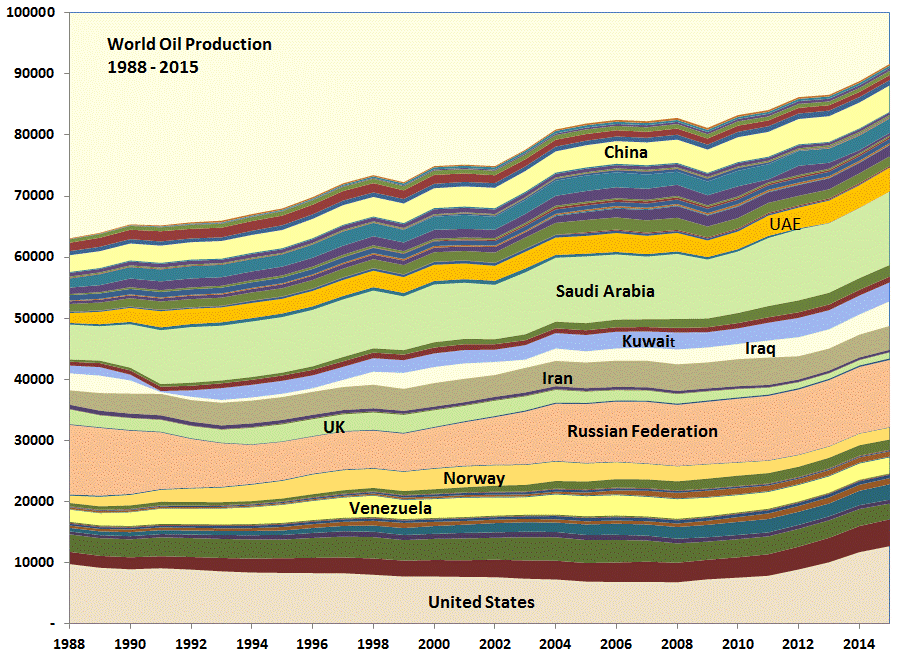
The BP Statistical Review of World Energy has oil production data by country up to the end of 2015. This is what that looks like from 1988:

chart/

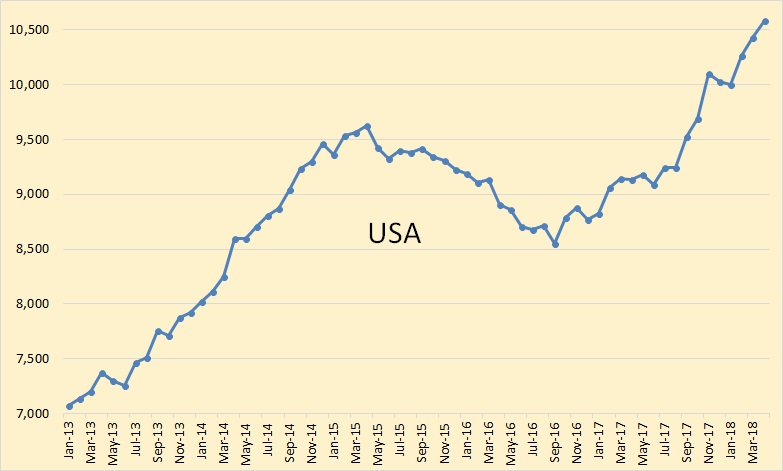
The United States increased production by 5.1 million barrels per day from 2010 to 2015. The increase in production from countries around the Persian Gulf over the same period was slightly less at 5.0 million barrels per day. The increase in total world production was 8.4 million barrels per day so the rest of the world declined by some 1.7 million barrels per day. This was despite Canadian production rising 1.0 million barrels per day from oil sands developments plus some other increases from Russia, Brazil, Colombia etc. Most oil producing countries are in well-established long term decline or plateau at best. How these trends will interact can approached from a bottom-up basis. To that end, the following graphs show likely production profiles by region for the next five years. Read More