Baker Hughes publishes a weekly oil and gas rig count by producing basin. I have created charts of all the most productive basins in order that we can see where oil and gas rigs are increasing or decreasing. Their historic rig count, by basin, goes back 4 years.
It needs to be noted that Baker Hugs does not count rigs that are not actively drilling. Rigs that are “Moving In, Rigging Up” are not counted in the Baker Hughes count though they are counted by some others including the North Dakota Industrial Commission.
All rig counts are of Friday, February 27, 2015.
 But first, total US weekly rig count. The oil rig count stands at 986, down 623 from a high of 1,609 in October. The gas rig count stands at 280, down 656 rigs from the high of 935 in October of 2011. However this data base goes back only 4 years. The all time high for gas rigs was 1,606 in September of 2008. The 1,609 oil rig count in October 2014 was an all time high for oil rigs. That record is valid only back to the days when Baker Hughes began separate stats for oil and gas rigs however.
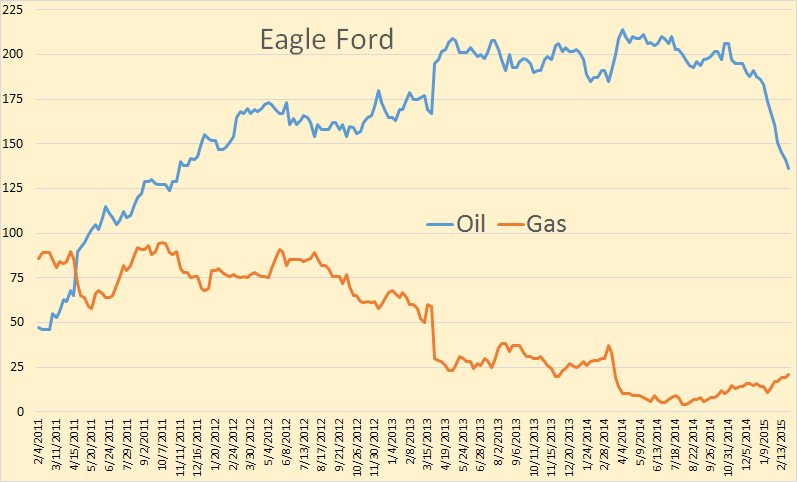
Eagle Ford oil rigs currently stand at 136, down from a high 214 in April 2014. Gas rig count is 21, down from 95 in October 2011.
Read More

