EIA’s Electric Power Monthly – August 2018 Edition with data for June

A Guest Post by Islandboy
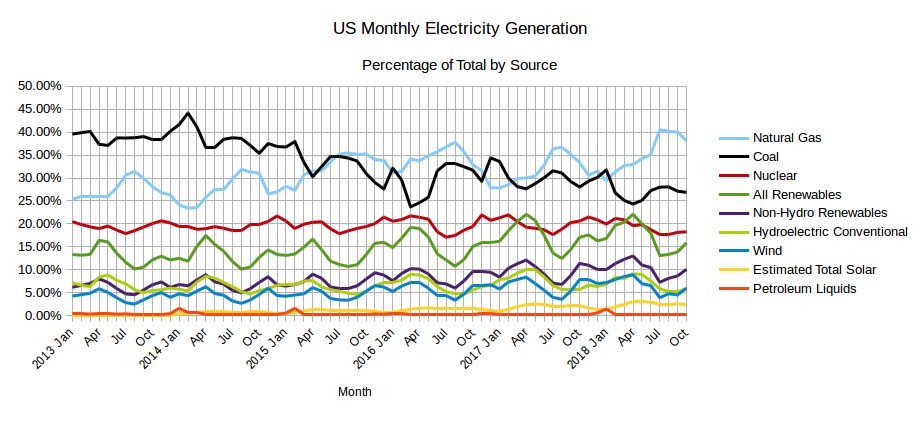
chart/

chart/

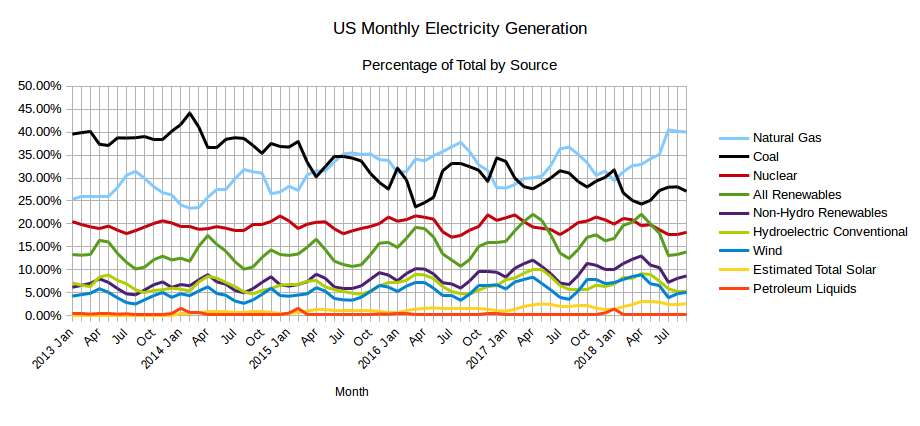
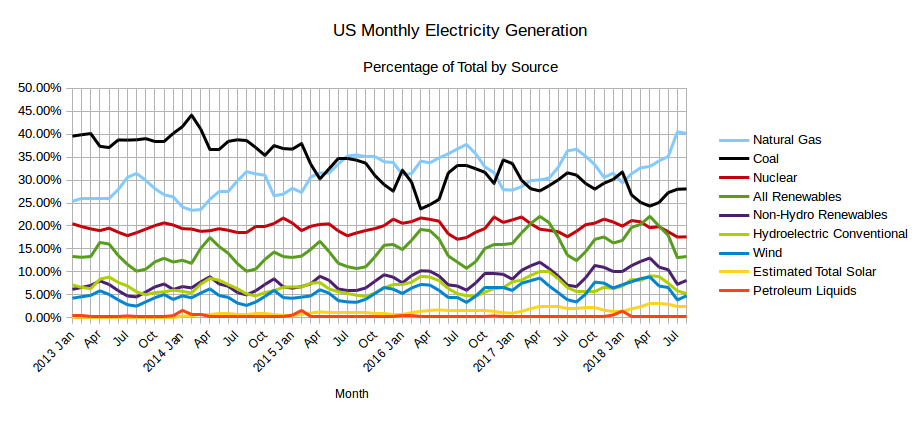
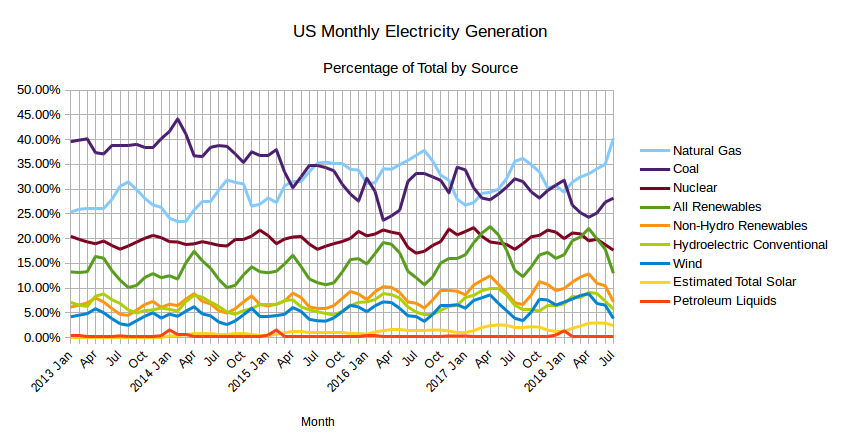
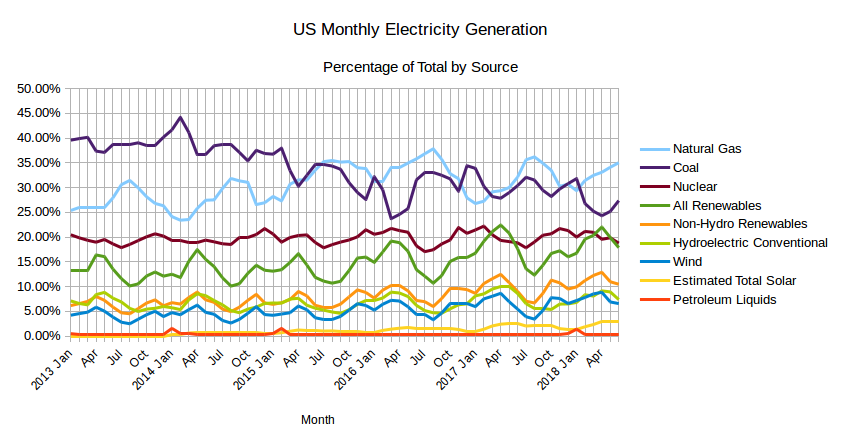
The EIA released the latest edition of their Electric Power Monthly on August 24th, with data for June 2018. The table above shows the percentage contribution of the main fuel sources to two decimal places for the last two months and the year to date. With the data for June now available some half year data can be produced. Below is a table showing the various changes in the amount of electricity generated for a few selected sources, All Renewables and Non-Hydro Renewables, between the first half of 2017 and the first half of 2018. Read More