Reverse Engineering the North Dakota Bakken Data

Notice: The data I thought would be out today: EIA Crude Oil Production by State will not be out until Thursday, Feb. 27th. However I will have another post coming out later today anyway.

This is a guest post by Ovi Colavincenzo

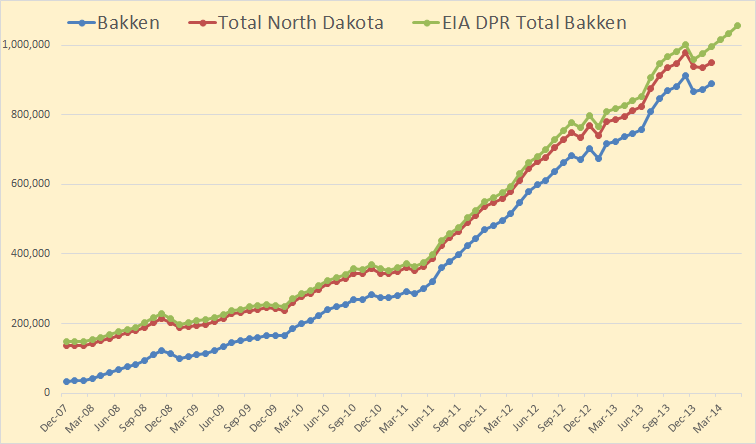
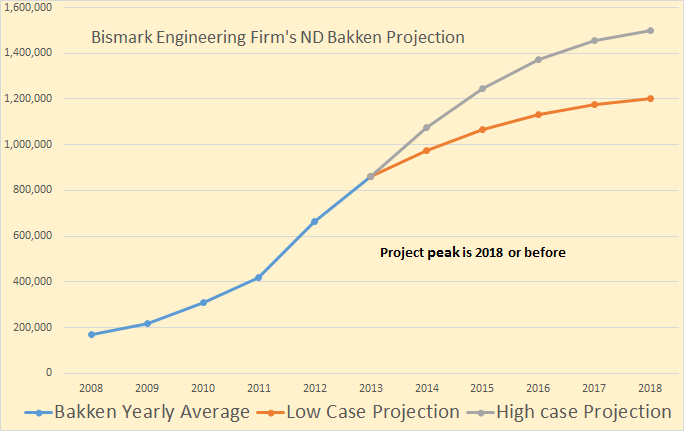
There is considerable discussion on this site regarding when the North Dakota portion of the Bakken will peak.  Having looked at the monthly Bakken data that the State publishes, it raised the question of whether it was possible to do a reverse analysis of the data and then use it to develop a model that would replicate the ND Bakken production, exactly.   The objective being to provide further insight on what is happening in the ND Bakken.

In order to do this, the following conditions and information were required:

  • A monotonically increasing number of new producing wells
  • A typical/average decline curve for the ND Bakken field
  • Not too many wells being shut/reworked each month

The last bullet is a preferred condition because if a number of low producing wells are shut and replaced by newer high producing wells, then the estimated flow rate of the new wells will be on the high side.

From 1999 to mid 2005, approximately 200 wells were in production in every month.  The addition of an increasing number of new wells began to occur in mid-2005, so start date for the analysis was set at the beginning of 2008 to address the first bullet point above.

AAA Ovi1

Figure 1: Source:  The Shale Revolution” by J.D. Hughes

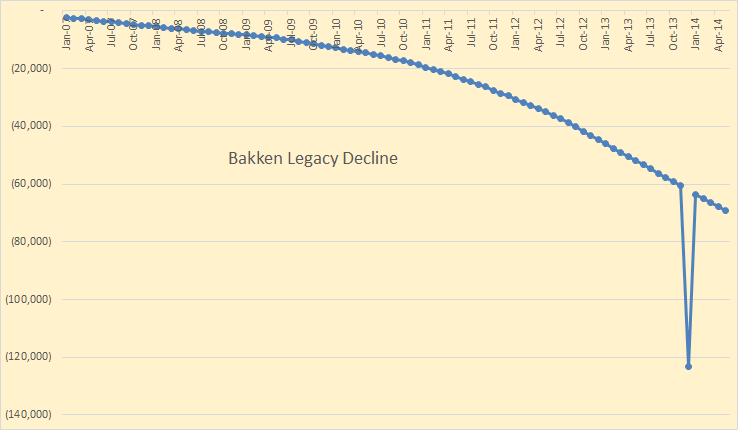
For the decline curves, two were used and are shown in Figures 1 and 2.  One came from “The Shale Revolution” by J.D. Hughes, November 19, 2013 shown in Figure 1.  The other came from North Dakota’s Directors cut, “Tribal Leader Summit” 09 05 12 (PDF), Figure 2.

AAA Ovi1

Figure 2: Source: North Dakota Director’s Cut “Tribal Leader Summit”

Read More

Bakken Update, Big Drop in December

North Dakota has published the latest production numbers.
ND Monthly Oil Production Statistics (All North Dakota)
ND Monthly Bakken* Oil Production Statistics (Bakken Only)

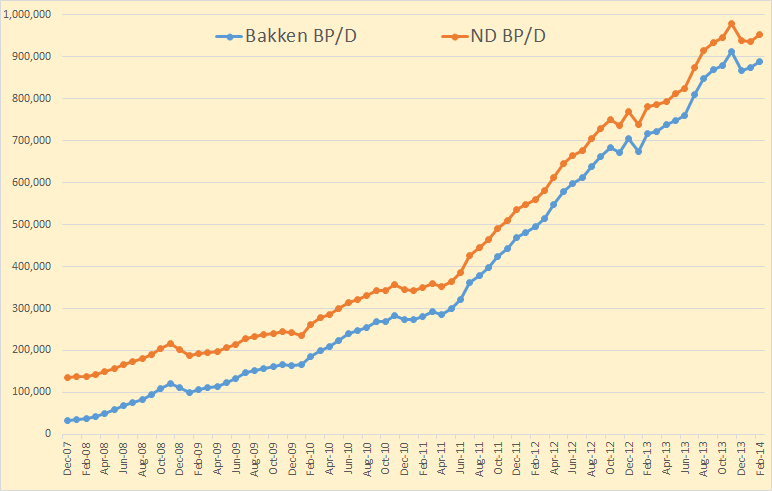
Bakken Barrels Per Day


Bakken production fell 48,395 bp/d to 862,389 bp/d and all North Dakota production fell 53,226 bp/d to 923,227 bp/d. That was after Bakken November production had been revised up by 2,908 bp/d and North Dakota November production was revised up by 3,173 bp/d.

From the Director’s Cut

<i>The drilling rig count was up from Nov to Dec, but the number of well completions dropped from 138 to 119. Days from spud to initial production increased 18 days to 132. Investor confidence appears to be growing, but there is still some concerns about the uncertainty surrounding federal policies on taxation and hydraulic fracturing regulation, but the big story is the December weather. Low temperatures of 21 to 31 degrees below zero, 4 major snow events, and 5 major wind events. Dickinson had the 4th coldest December on record and from Williston to Bismarck it was the 9th snowiest December since 1890.</i>

North Dakota Increase

The December decline in North Dakota production was the highest in the history of the state. Total North Dakota increased production in 2012 by 233,349 barrels per day. However the increase in 2013 was only 154,317 bp/d. Their production increase was 34 percent less in 2013 than it was in 2012.
Read More

OPEC Update and EIA Short Term Energy Outlook

The OPEC Monthly Oil Market Report is just out with OPEC crude only production numbers for January 2014. OPEC Crude production was up 28,000 bp/d in January but that was after December production had been revised upward by 240,000 bp/d. November production was revised down by 51,000 bp/d.

OPEC 12

Of course Saudi is always the one to watch because it is generally believed that they have spare capacity. I think they had spare capacity back in 2011 but are now producing flat out, just like every other OPEC producer.

Saudi Arabia

Saudi crude production was down 115,000 bp/d in January but that was after December production had been revised upward by 119,000 bp/d and November revised up 52,000 bp/d. I think that surge upward early in 2013 is a telling indication. That was Manifa coming on line.

Libya had the biggest gain in January, up 270,000 bp/d to 510,000. I guess peace may be breaking out in a few places there. Without Libya’s gain OPEC production would have been down by 242,000 bp/d.

Charts of all 12 OPEC nations can be found here: OPEC Charts.

Read More

EIA Quarterly Crude + Condensate Production Data

The EIA publishes all kinds of energy production data but I collect and chart only Crude + Condensate data. But that comes in three flavors, monthly, quarterly and yearly. I decided to chart the quarterly data and see if that looks any clearer than the monthly data.

Quarterly C+C production in kb/d. The last quarter, 3rd, ends September 2013.

World

World C+C production has increased 2 million barrels per day since the 2nd quarter of 05. Who were the big gainers that caused this 2 million barrel per day increase?

World Less USA

Turns out it was all USA.
Read More