Of Fossil Fuels and Human Destiny

There have been hundreds of books and essays written on the evolution of Homo sapiens and I assume you are familiar with that history. In this short essay I am going to point out a few things that are usually left out of that story, the part that deals with the very nature of the species Homo sapiens.

First I would like to point out a few things that are common to all species, not just Homo sapiens.

All species produce more offspring than can possibly survive to adulthood and reproductive age. Some produce hundreds of offspring and leave it to chance that a few will survive. Others produce far fewer offspring and care for them for months to years to increase their chances of survival.

However if there is ever an abundance of food for any species, that species will multiply its numbers to take advantage of that abundance until its numbers are so great that the advantage disappears. An example would be the reindeer of St Matthew Island.

In August of 1944 the Coast Guard placed 29 reindeer on St. Matthew Island, a remote island in the Bering Sea. Earlier in the year they had established a radio navigation system there and the Reindeer were supposed to be emergency rations should the men be cut off from supply shipments.

A short while later, with the allies winning the war, the Coast Guard pulled their men off the island but left the reindeer there. But not to worry, the 32-mile long by 4-mile wide island had plenty of the reindeers favorite food. A mat of lichens over 4 inches deep covered the island. By 1957 the population had increased to 1,350; and by 1963 it was 6,000. But the lichens were gone, and the next winter the herd died off. Come spring, only 41 females and one apparently dysfunctional male were left alive.

Reindeer

Another example was documented by the PBS series NOVA titled Rat Attack. [1] This program documents the plight of rice farmers in a remote corner of northeast India. Surrounding the rice fields in this area are forests of bamboo, a common species called Melocanna bamboo, from which the locals build their homes. And living in this tropical bamboo forest are rats. This is not unusual as rats live in all tropical forest around the world. But the rats are few enough in number that they pose no serious threat to the rice and corn farmers in the area

However once every 48 years all the bamboo flowers, fruits then dies. The Melocanna bamboo produces a fruit, a seed pod, that is as large as an apple, some 200 times larger than the average bamboo seed pod. Over the period of a few months some 10 tons per acre of this fruit will ripen and drop. This indeed brings about times of plenty for the rats in the area.

One species of rat, the black rat, is particularly adapted to take advantage of this cornucopia of food. In the right conditions their numbers will shoot up exponentially.

When the bamboo fruit first appears around this one particular rice field the black rats numbered perhaps 100. By the time all the bamboo fruit had all ripened, fell and most of it consumed by the rats, a period of about six months, the black rat population numbered about 12,000. By then any fruit left in the forest had germinated and was inedible. This hoard of rats then moved into the rice fields devouring the crops causing famine in the local population.

Then, when all the food is gone the rats die off. They die of starvation. But a few, a very few will survive.

Read More

How Soon Will the World Oil Production Peak?: A Hubbert Linearization Analysis

This is a Guest Post By “Political Economist”

In this informal paper, I conduct Hubbert Linearization exercises on the world’s 11 topoil producers as well as the rest of the world. The results are used to project the world oilproduction in the future. The evidence presented in this exercise suggests that the world oil production may peakin 2018 or a few years later.

Hubbert Linearization

Hubbert Linearization (first developed by M. King Hubbert) is a statistical techniqueoften used in the peak oil literature. Hubbert Linearization assumes that oil production rises and falls following a pattern thatcan be described by a logistic function:

Q(t) = URR / [1 + EXP (a(Tpeak-t))]

Q(t) is the cumulative oil production up to year t, URR is the ultimately recoverable oil resources, EXP represents the natural exponential function with the Euler’s number “e” being the base, “a” indicates the intrinsic growth rate of the logistic function, Tpeak is the year of peak oil production, and “t” is the current year.

If one takes the derivative of the above equation with respect to “t”, the above equation can be reduced to: dQ/dt = aQ(1-Q/URR) Replace dQ/dt with P (current annual production) and divide both sides by Q:

P/Q = a – (a/URR) Q

If one uses historical data to conduct a linear regression of P/Q over Q, one can solve the two parameters: “a” and “a/URR”. URR (the ultimately recoverable resources) would be solved accordingly. The peak year could in turn be solved.

If one has historical data, Hubbert Linearization is relatively simple and straightforward. But the method has important limitations. Most importantly, it cannot predict future technical changes that will change the amount of recoverable resources. In many cases, the results of Hubbert Linearization are sensitive to the time period used for regressions. The selection of time period often depends on subjective interpretation of available data.

Nevertheless, Hubbert Linearization does reflect the outcomes of historical interactions of geological, economic, geopolitical, and technical factors as well as their evolving trends. When used carefully in combination with other available information, it can provide useful insights into the future trajectory of world oil production.

The World’s Largest Oil Producers

This paper uses BP’s definition of oil production, which defines “oil” as the sum of crude oil and natural gas liquids. The data are mostly from BP Statistical Review of World Energy, extended to 2013 using EIA’s International Energy Statistics.

By this measure, the world’s eleven largest oil producers in 2013 (ranked by their oil production) were Saudi Arabia, Russia, United States, China, Canada, Iran, Iraq, United Arab Emirates, Kuwait, Mexico, and Venezuela.

In this paper, all oil production statistics are stated in million tons. For a rough conversion, 50 million tons of annual oil production roughly equals 1 million barrels of daily production.

Figure 1
pefig/

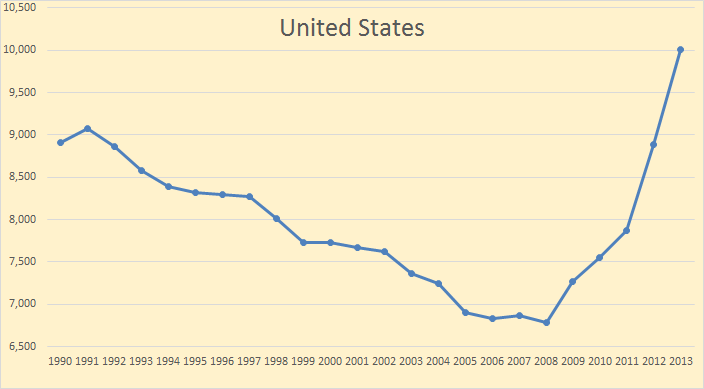
Figure 1 shows the oil production of the eleven top producers as well as the rest of the world. From 2005 to 2013, the world’s total oil production increased by 192 million tons. Saudi Arabia’s oil production increased by 19 million tons, the Russian oil production increased by 57 million tons, the US oil production increased by 139 million tons, China’s oil production increased by 28 million tons, Canada’s oil production increased by 52 million tons, Iran’s oil production fell by 40 million tons, Iraq’s oil production increased by 66 million tons, the UAE oil production increased by 19 million tons, Kuwait’s oil production increased by 23 million tons, the Mexican oil production fell by 44 million tons, Venezuela’s oil production fell by 30 million tons, and the entire rest of the world’s oil production fell by 97 million tons.
Read More

Proven Reserves, IOCs and Other News

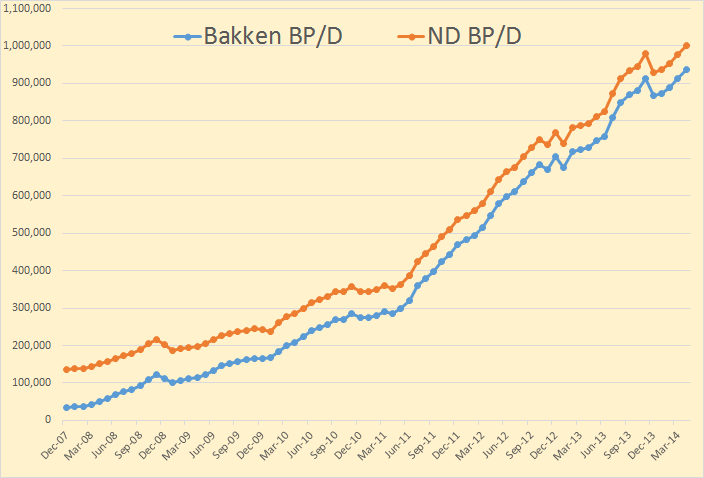
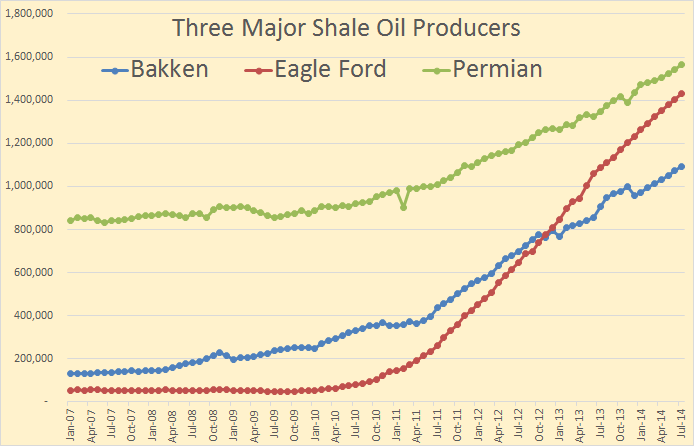
Not much new data to report this past week but I did try to hammer out a few things of interest. The EIA released their Crude Oil Production report for the US and individual states with data through February 2014. I combined Montana and North Dakota to show their production.

Mont+NDTheir combined production was 1,027 kb/d. This is still below their production of 1,055 kb/d in November. This is more than just the Bakken as both Montana and North Dakota have production outside the Bakken.

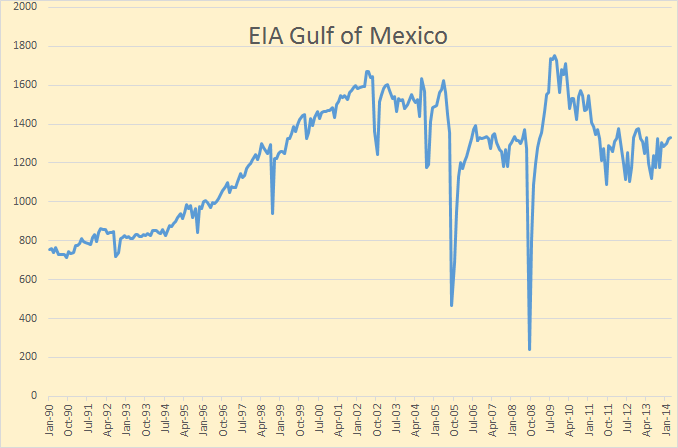
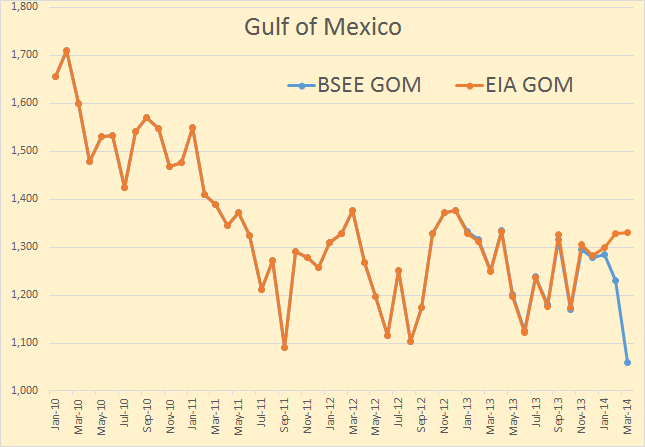
GOM ProductionPart of the EIA’s plan for 9.6 mb/d of C+C by 2016 has The Gulf of Mexico going to 2 million bp/d by 2016. The GOM does not appear go be going anywhere however. There are new fields coming on line but they are just barely keeping up with those very high decline rates of the deep water fields. The Gulf of Mexico has her very own Red Queen.
Read More

Is Peak Oil Waiting for Godot?

Waiting for Godot was a two act play by Samuel Beckett where two men kept waiting for Godot and they just kept waiting and waiting and waiting… And no, I don’t think we will be kept waiting and waiting like the characters in that play. Peak oil is about to arrive, in my opinion anyway.

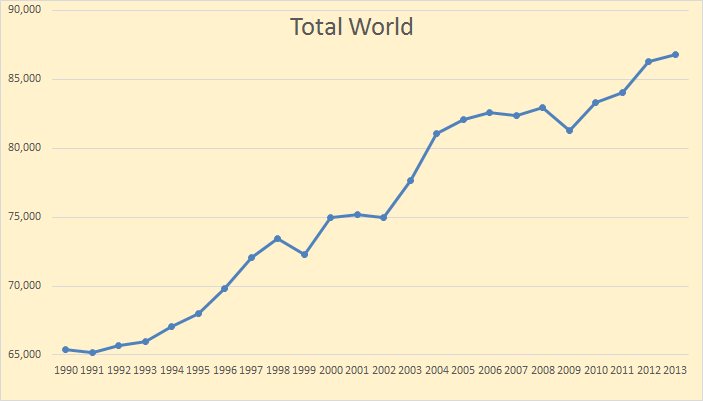
Way back in 2005 we thought it likely that crude oil production had peaked at just under 74 million barrels per day. During the preceding three years C+C production had risen by 6,481,000 barrels per day or 2,160,333 barrels per day per year. The reason for that dramatic increase was a doubling in the price of oil from $25 per barrel in 2002 to $54.43 in 2005.

So oil production depends, to a great extent, the price of oil. The more money the more oil. However…  The C+C data in all charts below are in thousand barrels per day.

Brent Price Vx. Production

 You can see that another doubling of Brent oil price in the next 8 years brought only 2,283,000 bp/d of new oil on line, or an average of 285,375 bp/d per year.

So where did the increase in C+C come from between 2002 and 2005, and where has it come from since.

Change Since 2002

You can see the major addition to World C+C between 2002 and 2005 was from Eurasia, (FSU) the Middle East and Africa. The only major decline was from Europe, primarily the North Sea. Since 2005 the major gainers were North America followed by the Middle East and Eurasia, which we used to refer to as FSU. But 8 years is a long time, what has happened during those 8 years.
Read More