Comments related to oil and natural gas in this thread please.
Any Non-Petroleum comments should go under the Electric Power Monthly post below. Thanks.
Comments related to oil and natural gas in this thread please.
Any Non-Petroleum comments should go under the Electric Power Monthly post below. Thanks.
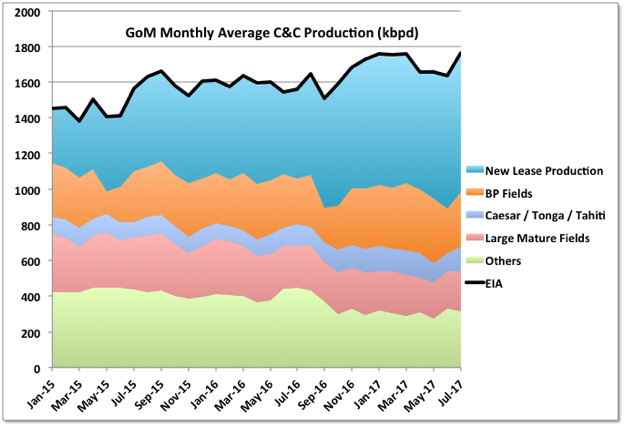
GoM C&C production for July by BOEM was 1746 kbpd and by EIA 1761, compared with, respectively, 1631 and 1634 kbpd (corrected) in June. The EIA number is a new peak, the BOEM one is still 24 kbpd short of their March numbers. The growth was from Thunder Horse (partially), Constitution and Baldpate/Salsa (which is mostly gas) coming back on-line, plus continued ramp-up in Stones and Marmalard.

This is an update to the post An Empirical Model For Oil Prices and Some Implications in which we discussed a model for oil prices as a function of 3 years of production, that is oil price in year t was estimated by production in year t, the discrete first derivative of production in year t, and the discrete second derivative in year t. We subsequently published a paper titled Oil Extraction, Economic Growth, and Oil Price Dynamics using the same model. This article contains most of our intuition on how peak oil will effect oil prices. We believe in fact that peak oil is about extraction prices rising faster than market prices and hence lower profitability for the oil industry.
Before going on, we note that all available data is very approximate. Jean Laherrère has exhaustively documented incoherence in extraction data from all standard sources [1]. We use a single price of oil provided by BP, but there is a large spectrum of prices for oil of different densities, chemistry, and provenance [2]. For this reason we do not search a perfect fit but rather try to understand the dynamics creating oil demand. Read More
All data below is based on the latest OPEC Monthly Oil Market Report.
All data is through August 2017 and is in thousand barrels per day.

The above chart does not include the 14th member of OPEC that was just added, Equatorial Guinea. I do not have historical data for Equatorial Guinea so I may not add them at all. OPEC production has held steady for the past three months. Their production was down 79,000 barrels per day in August but that is not a big drop when production is over 32.5 million barrels per day.
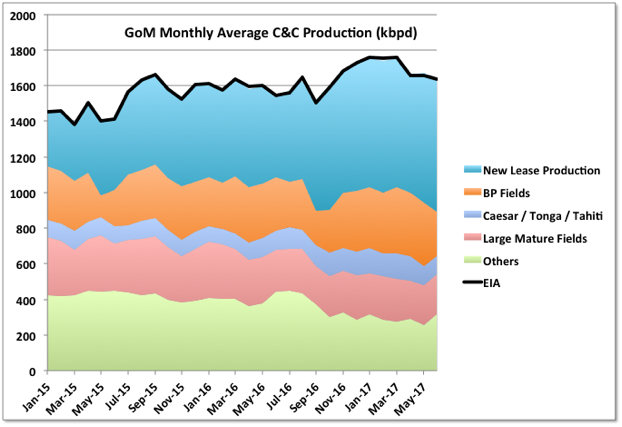
Production for June by BOEM was 1631 kbpd and by EIA 1636, compared with 1673 and 1659 kbpd, respectively, in May. The decline was mostly from Thunder Horse going offline and Constitution staying offline. Hurricane Cindy didn’t seem to have much of an impact, things will be different for the impact of Harvey on August figures.
Even with the two offline facilities coming back July numbers will struggle to beat those for March, and after that the depletion declines and hurricane disruptions take over. Note that the “others” area includes any assumptions BOEM has made to allow for missing data, which is quite a lot this month.
