Brazil: Reserves and Production

Guest Post by George Kaplan

Brazil is a major oil producing country, but in 2016 was still a net importer, though imports dropped significantly and they have been a slight exporter overall so far this year. It is one of the few countries that have consistently grown production over recent years, and possibly the only non-OPEC country that will show overall growth of conventional crude in the ten years to (say) 2022.

Production

Brazil ANP or anp (Agência Nacional do Petróleo, Gás Natural e Biocombustíveis) publishes Excel files for monthly production on all wells. In theory it should be easy to extract field data from these, in practice not so much. The files are downloaded from a database but not always consistently, sometimes in field units sometimes SI, sometimes one month per file sometimes more, around 2010 onshore and offshore was split but naming conventions weren’t always followed, handling of wildcat wells seems a bit arbitrary, and spelling conventions can change. However after more effort than I expected I did download the data and split it by basin and field.

The total production fits Jodi data well except for three periods: 2005 when the reports stated, and doesn’t make much difference; 2010 when ANP split offshore and onshore reporting and the well files are a complete mess; and 2017, which may indicate that some of the data is revised (this should become evident as more releases are made over the next months).

chart/

Read More

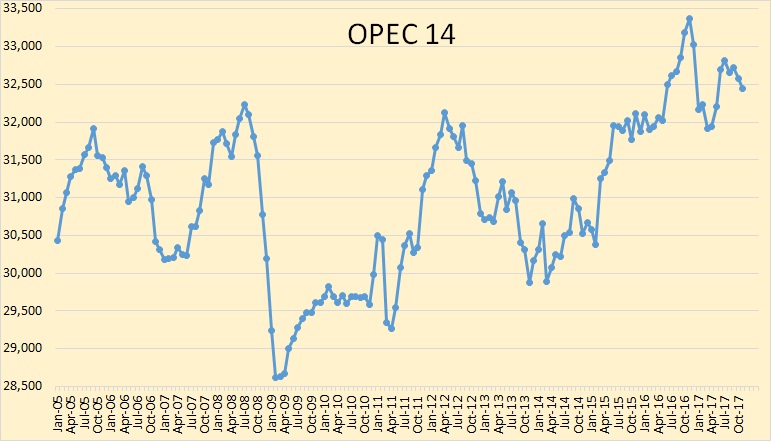
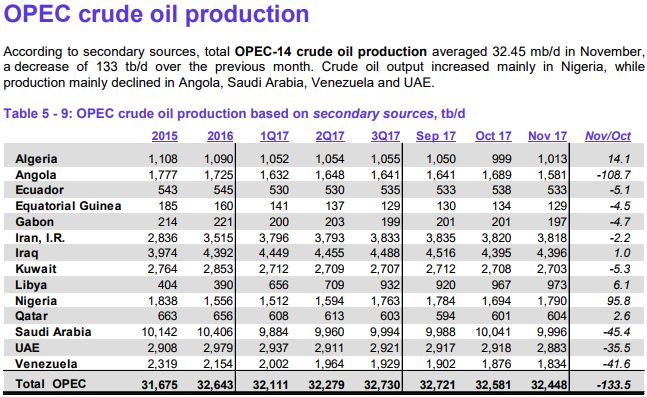
OPEC June Production Data

All data below is based on the latest OPEC Monthly Oil Market Report.

All data is through June 2017 and is in thousand barrels per day.

The above chart does not include the 14th member of OPEC that was just added, Equatorial Guinea. I do not have historical data for Equatorial Guinea so I may not add them at all. It doesn’t really matter since they are only a very minor producer. Also, they are in steep decline, dropping at about 10% per year.

Read More

MEXICO Oil Reserves and Production

This is a Guest Post by George Kaplan

In dollar terms, since mid 2015 Mexico has been a net importer of hydrocarbons (oil, natural gas, petroleum products and petrochemicals combined). To date it has been a relatively small and fairly constant amount, but with their oil production declining, and oil prices apparently continuing to fall while natural gas prices may be on the rise, the net cost could now start to increase.

chart/

Read More

World Energy 2017-2050: Annual Report

A Guest post by:

Dr. Minqi Li, Professor
Department of Economics, University of Utah
E-mail: minqi.li@economics.utah.edu

This Annual Report evaluates the future development of world energy supply and its impact on the global economy as well as climate change. The report projects the world energy supply and gross world product (global economic output) from 2017 to 2050. It also projects carbon dioxide emissions from fossil fuels burning and the implied global average surface temperature from 2017 to 2100.

chart/

Figure 18
Sources: World historical oil, natural gas, and coal consumption from 1950 to 1964 is estimated from carbon dioxide emissions (Boden, Marland, and Andres 2017); world primary energy consumption and its composition from 1965 to 2016 is from BP (2017); world primary energy consumption and its composition from 2017 to 2050 is based on this report’s projections. Read More

OPEC May Production Data

All data below is based on the latest OPEC Monthly Oil Market Report.

All data is through May 2017 and is in thousand barrels per day.

OPEC crude only production was up 336,000 barrels per day in May. The two countries that are not subject to OPEC quotas, Nigeria and Libya, were up a combined 352,000 barrels per day. That means the rest of OPEC was down 16,000 bpd. And all this was after OPEC April production was revised upward by 72,000 barrels per day.

Read More