GoM Production, 2017 Summary

A Guest Post by George Kaplan

2017 was the highest producing year for oil in the GoM and included the record month in March. Gas, which has tended to come from shallow water wells, had accelerated decline. The production would have been higher but for some disruptions from Hurricanes, in particular Nate, though that had the least impact onshore, and some unplanned outages in November and December due to equipment failures. The failure to Delta House subsea manifold affected Rigel, Otis and Son of Bluto 2 fields, and the first two still appear to be off-line while Son of Bluto 2 resumed production in December (LLOG, the operator, I think calls the Rigel field Neidermeyer, which is much better for the Animal House theme). The Enchilada gas pipeline appears to have ruptured at the main platform and has resulted in Baldpate, Salsa, Llano, Cardamom and Magnolia going off-line. Plans were recently announced to restart Baldpate/Salsa, which do not go through the platform, but I haven’t seen any notice of the restart.


Oil Average

Oil Exit Rate

Gas Average

Gas Exit Rate

Total Average

Total Exit Rate

  (kbpd) (kbpd) (mmscfd) (mmscfd) (kboed) (kboed)

2016

1600 1728 3308 3363 2151 2289

2017

1685 1570 2955 2381 2177 1967

Change

85 -158 -354 -982 26 -322

Ratio

5.3% -9.1% -10.7% -29.2% 1.2% -14.1%

C&C Production

December production numbers were dominated by the unplanned outages, so comparisons with November don’t mean much. As well as the two issues given above the Tahiti and Caesar/Tonga fields were off line for a few weeks, though I have seen no news why (these share a common set of leases but are produced separately to the Tahiti and Constitution platforms). Each month that these are three issues hold current outages would knock about 10 to 12 kbpd off the achievable average production for 2018.

chart/

Despite recent variability it certainly looks like the new fields brought on since late 2013, and which have seen all the net growth since then, have peaked. Any average decline rate can’t really be extrapolated yet, given the recent upsets, but the BOEM reserve estimate updates, due in the next couple of months, will provide better R/P numbers as there will be longer operating data for all the fields.

chart/
Read More

Oil Price Outlook December 2017

A Guest Post by David Archibald

The views expressed in this post are those of the author alone.

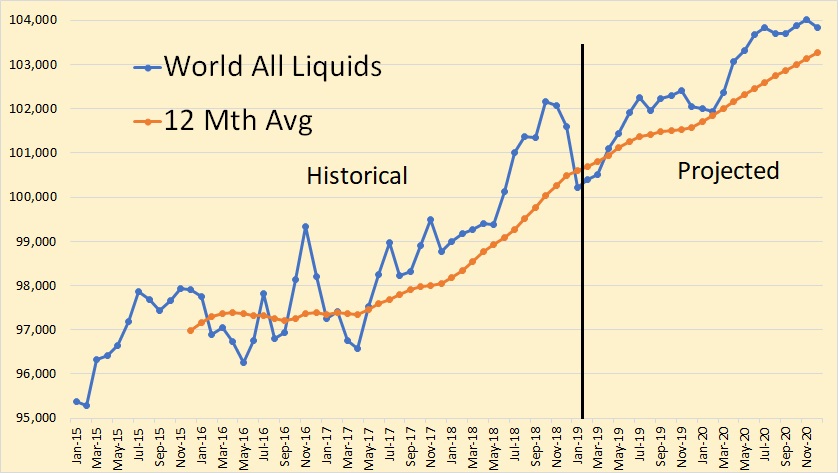
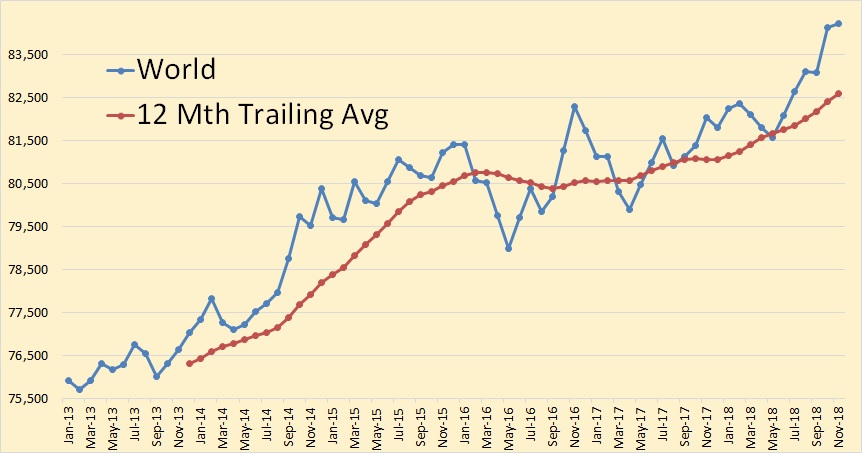
This assessment is based on the data in the 2017 BP Statistical Review of World Energy available here. As such it uses that review’s definition of oil which is crude and condensate and natural gas liquids, uncompensated for their different energy contents or values of refined product components.

chart/

Figure 1: World Oil Production 1990 – 2017
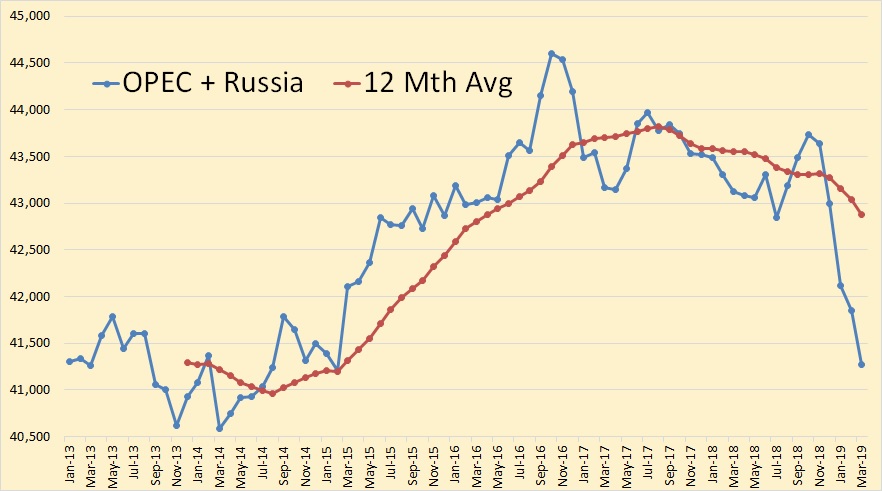
This analysis was prompted by a chart by Ovi showing that Non-OPEC production less Russia, Canada and the United States has been in decline since 2004. That decline rate is 0.25 million barrels/day/annum. It had previously risen strongly from 1990. Read More

Carrying Capacity, Overshoot and Species Extinction

Notice: Please limit your comments below to the subject matter of this post only. There is a petroleum post above this one for all petroleum and natural gas posts and a non-petroleum post below this one for comments on all other matters.

First, let us define carrying capacity and overshoot. And none has done that better than Paul Chefurka.

Carrying Capacity: Carrying capacity is a well-known ecological term that has an obvious and fairly intuitive meaning: “the maximum population size of a species that the environment can sustain indefinitely, given the food, habitat, water and other necessities available in the environment”.  Unfortunately, that definition becomes more nebulous the closer you look at it – especially when we start talking about the planetary carrying capacity for humans.  Ecologists claim that our numbers have already surpassed the carrying capacity of the planet, while others (notably economists and politicians…) claim we are nowhere near it yet!

Overshoot: When a population surpasses its carrying capacity it enters a condition known as overshoot.  Because carrying capacity is defined as the maximum population that an environment can maintain indefinitely, overshoot must by definition be temporary.  Populations always decline to (or below) the carrying capacity.  How long they stay in overshoot depends on how many stored resources there are to support their inflated numbers.  Resources may be food, but they may also be any resource that helps maintain their numbers.  For humans one of the primary resources is energy, whether it is tapped as flows (sunlight, wind, biomass) or stocks (coal, oil, gas, uranium etc.).  A species usually enters overshoot when it taps a particularly rich but exhaustible stock of a resource.  Like oil, for instance…

Read More

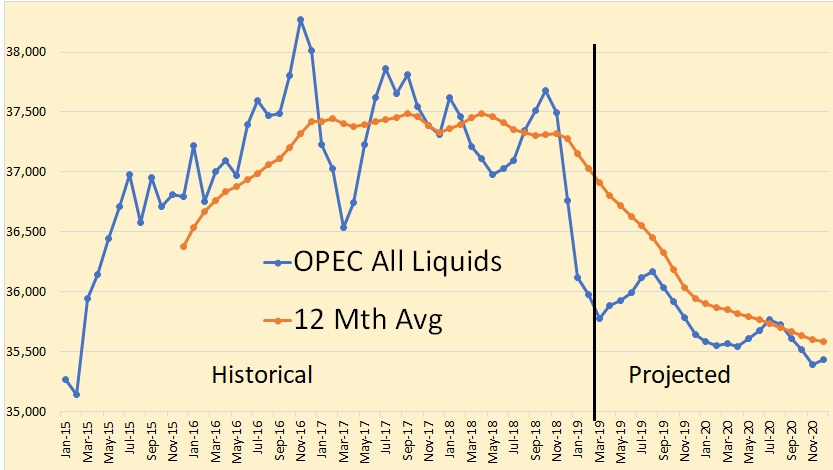
OPEC October Production Data

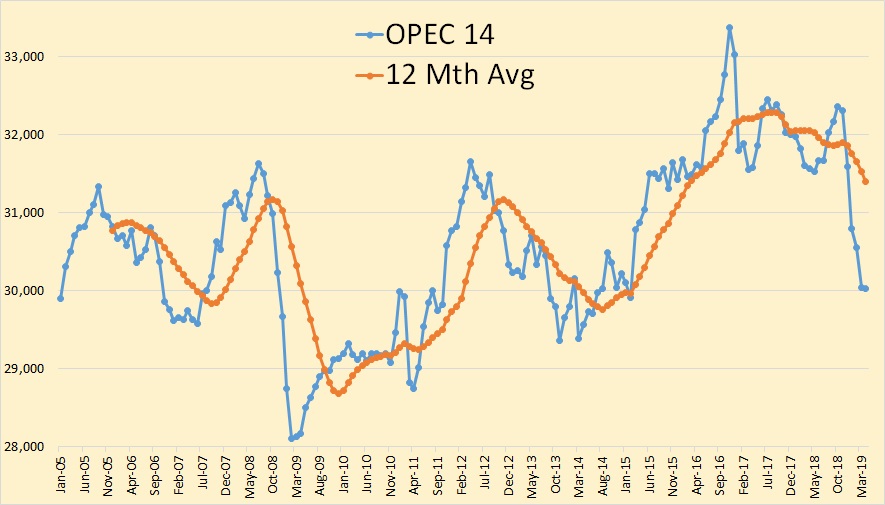
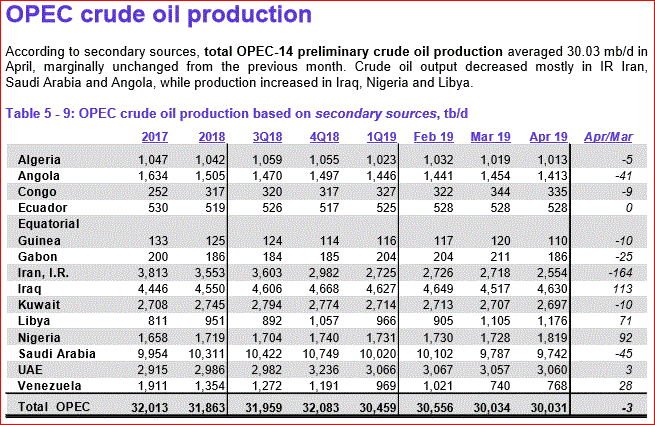
All data below is based on the latest OPEC Monthly Oil Market Report.

All data is through October 2017 and is in thousand barrels per day.

I have now included Equatorial Guneia although I only have data from January 2015 from OPEC’s secondary sources. The January 2015 E. Guneia data was extended back to January 2005. I know this is inaccurate but production from E. Guneia is so small it will make little difference.

Read More