World Crude Oil Exports

OPEC has released their Annual Statistial Bulletin 2014. Under the heading of “Oil and Gas Data” there are several tables you can download. I was excited to find one labeled “Table 3.21: World Exports of Crude Oil and Petroleum Products by Country”. It turned out to be useless however as it includes a lot of exports of imported products. And they have no table of “Net Imports”. However their their table labeled Table 3.18: World Crude Oil Exports by Country” turned out to be very useful as it seems to measure the same thing as the EIA does in their International Energy Statistics, Crude Oil Exports which also includes lease condensate.

The OPEC export data goes back to 1960 but I have only plotted it from 1990. The EIA data only goes back to 1993. The OPEC data is through 2013 while the EIA data only goes through 2010 except for Canada, Mexico and Norway which goes through 2012. All data is in thousand barrels per day.

World Exports

World crude oil exports peaked in 2007 and now stand 42,297,000 bp/d and in 2013 stood 2,467,000 bp/d below that point. World crude oil exports in 2013 were 2,467,000 barrels per day below peak and at the lowest point in 10 years.

OPEC Exports

OPEC exports peaked, so far, in 2012 at 25,068,000 barrels per day. Their exports fell by just over 1,000,000 barrels per day last year and I am betting they will fall further this year.

Non OPEC Exports

Non-OPEC exports have taken a hit in the last few years, peaking in 2004 and are down just under three million barrels per day since then.

Read More

OPEC Update also Moscow Confirms Russian Oil Production in Decline

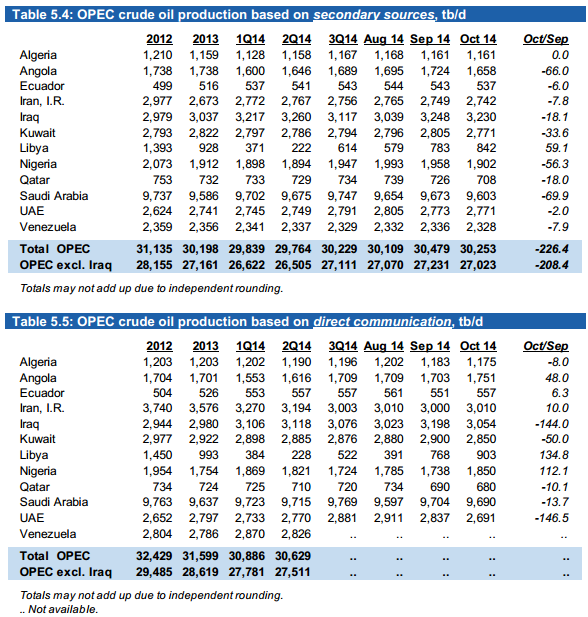
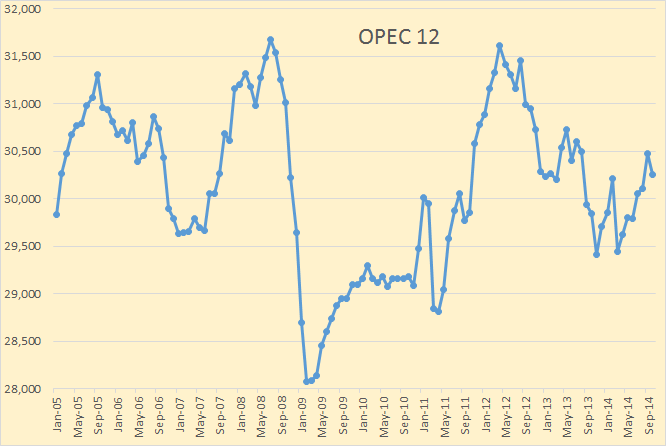
OPEC has just published their latest Monthly Oil Market Report with the June production numbers. All data is in thousand barrels per day and is Crude Only.OPEC 12

All revisions in the May data were minor. The June OPEC Crude Only production was down 80,000 bp/d from May.

Iraq

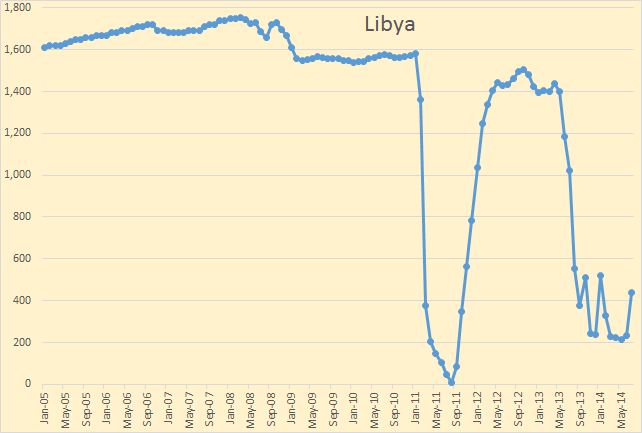
The big story in June was the invasion or Iraq. It has has only minor effect on production. Iraqi production was down 169,000 bp/d in June.

Saudi Arabia

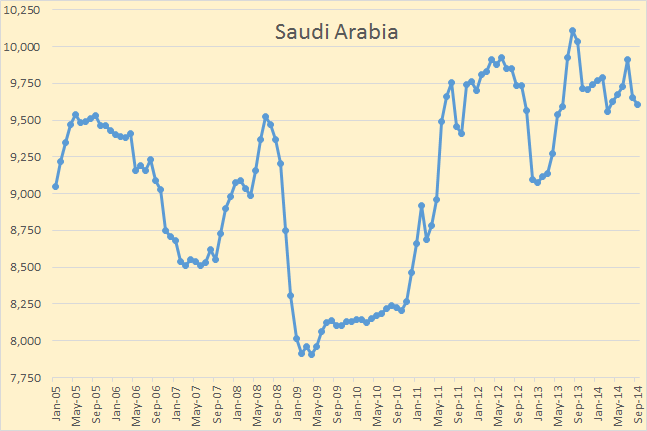
OPEC’s largest produce and the World’s largest exporter, Saudi Arabia, increased Crude production by 48,000 bp/d in June. There has been very little change in Saudi production in the last nine months.

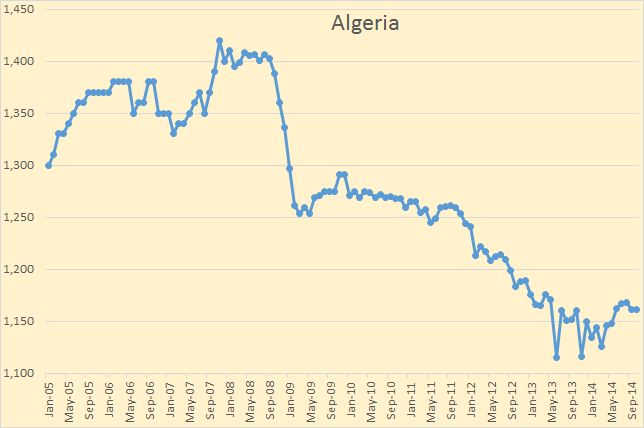
All other OPEC producers had very little change from May to June. Charts of all 12 OPEC nations can be found on the OPEC Charts page.

Read More

North Dakota and the Bakken by County

Looking at North Dakota oil production by county, and historical production by county, gives a better  perspective of what is happening in the Bakken and the rest of North Dakota than just looking at total production.

The data is available here: ND Historical Barrels of Oil Produced by County You will notice it says:(Confidential Wells are Not Included). However the total North Dakota does include confidential wells. And I have made adjustments for the confidential wells. The adjustment for March and April came from the NDIC here: State Summary Report April 2014.
Bakken Counties

The above chart is after adjustment for confidential wells. Even the lowest producer of the big four, Dunn County, outproduces the rest of North Dakota combined.

McKenzie

McKenzie was up 7,168 barrels per day after adjustment this month.
Read More

OPEC Update and news from Iraq

The new OPEC Monthly Oil Market Report just came out with their Crude Only production numbers for May. All data in the OPEC charts are in thousands barrels per day.

OPEC 12

There was very little in production changes and no surprises in the May data. Total OPEC production was up 142,000 barrels per day and that was after the April numbers had been revised up by 29,000 bpd.

Iraq

Everyone is concerned about Iraq. Iraq’s April numbers were revised down by 22,000 bpd and May production was up 18,000 above that revised number. Iraqi production stood at 3,331,000 bpd in May but I expect that number will change in June and most definitely in July.
Read More

Jean Laherrere’s Take, Plus Other News

Note: Jean Laherrere sent me the below post and asked me to post it in reply to comments posted by Dennis Coyne and Political Economist on my post Bakken Update, March Production Data. But that was several days ago, the comments are stale. Also it was too large for a comment. So since we are a period where there is a dearth of data, I decided to make a post of it. Below Jean’s graphs and comments I have added a couple of news Items.
_______________________________________________

Policial Economist displays a graph for Bakken production Hubbert linearization trending towards 3.5 Gb, but it is from EIA DPR for the period January 2007 to June 2014 : it is not real data (we are not yet in June 2014) but estimates.

It is different from mine trending towards 2.4 Gb, but it is only for North Dakota Bakken using ND state data from 1955 up to March 2014.

In many of my papers I state that production Hubbert linearization is not very reliable and it is better to rely on the creaming curve of cumulative backdated 2P discovery versus cumulative number of fields. But for LTO there is no reliable way to estimate 2P reserves, because only the volume generated by the source rocks (using Rock Eval measures from cores) can be estimated but the amount lost from this generated oil and gas cannot be estimated and the recovery from what is left within the fractures needs longer historical data.

Laherrere E

The ND production excluding Bakken Hubbert linearization trends also towards 2.5 GbLaherrere

It is why I use a NG oil ultimate of 5 Gb with both 2.5 Gb for Bakken and non-Bakken.
Read More