Just How Accurate Are The EIA’s Predictions?

The EIA recently published the February edition of their Short-Term Energy Outlook. If you follow this month to month, and I do, you will notice their prognostications change a little every month. And over several months those small changes can add up to some rather dramatic changes. Nevertheless, below are several charts with their current oil production projections.

The EIA STEO only gives monthly data for total liquids. All C+C data is quarterly and annually. The monthly projected data begins in February 2016. Projections for quarterly and annual data begins January 2016.

ST Non-OPEC Liquids

The EIA says Non-OPEC total liquids dropped .5 million barrels per day in December and another .36 mbd in January. But then, other than another short drop in the first quarter of 2017, they see things leveling out for the next two years.

Read More

OPEC January Production

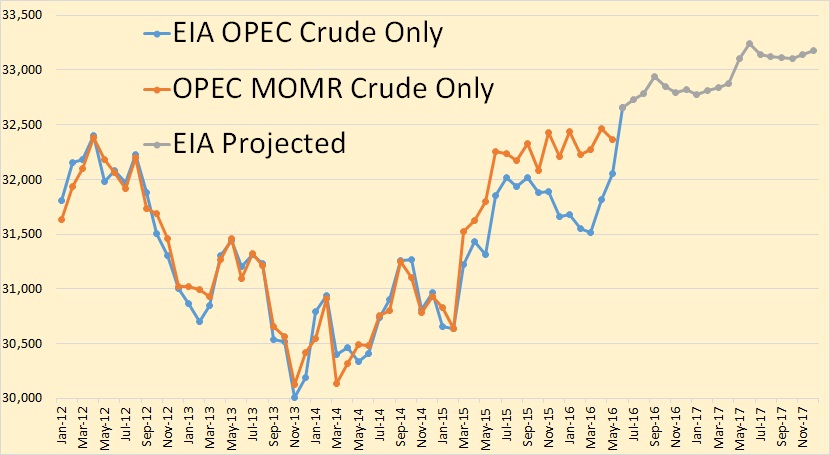
The latest OPEC Monthly Oil Market Report is just out. The the data is “Crude Only” production and do not reflect condensate production.

Also the charts, except for Libya, are not zero based. I chose to amplify the change rather than the total. The chats do not include Indonesia. That will be added within the next few months when I am able to get better historical data for Indonesian crude only production. 

All Data is in thousand barrels per day.

OPEC 12

OPEC production, not including Indonesia, was up 130,700 barrels per day in December.

Read More

A Closer Look at OPEC

Taking a closer look at OPEC. All OPEC and price data below is through December. All production data is in thousand barrels per day.

Iran and Libya have had serious political disruptions in their production numbers. Simply adding them to the OPEC numbers distorts the picture. To try to figure out what has been happening to OPEC we need to look at OPEC without Iran and Libya.

OPEC Less Iran and Libya

Here is OPEC less Iran and Libya, or the OPEC 10 if you will. I have marked August 2012 as what I call the “Price Peak”. Not the peak in oil prices but the production peak that was brought about by the increase in the price of oil. That price increase began in early 2009 and by March 2011 was well above $100 a barrel. And the price of oil did not drop below $100 a barrel until late August 2014.

Read More

OPEC, except for Iran, Has Peaked

The OPEC Monthly Oil Market Report is out. OPEC took a hit in December, down 205,000 barrels per day. After examining the past and present production numbers, I believe that OPEC, except Iran, has peaked. That is, the combined production from all the other OPEC nations, has peaked. And any additional production from Libya is likely to be in tiny increments that won’t make much difference in the big picture. Other OPEC nations may show a slight increase from their current level. But the combined production from all the other 11 OPEC nations, 12 if you count Indonesia, has peaked.

Of course there will be some small increases from the other 11 OPEC countries from time to time but overall, in 2016 and beyond, I believe it will OPEC will be from flat to down, with a greater chance of being down. That is we are at, or near, the peak right now. There might be a slight uptick of their combined production in the coming months but not enough to get excited abut.

All Data in the charts below is through December and is in thousand barrels per day.

OPEC 12

OPEC production, in the chart above does not include Indonesia. OPEC 12 was down 204,000 barrels per day.

Read More

Doubting The Peak in 2015

Dennis Coyne, an editor and frequent contributor to this blog, has suggested that we are not at peak oil. He argues that there is likely to be a dip in production starting next year but higher prices will cause things to turn around and we will surpass the 2015 peak by 2019. He commented a few days ago:

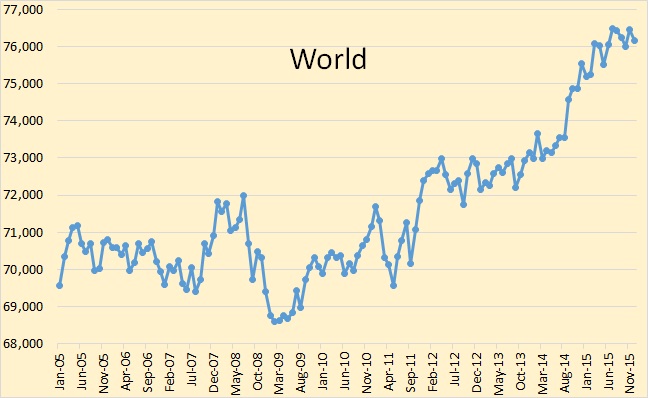
If we take some of the larger producers that have been increasing output and compare with the rest of the world(ROW) using EIA data from Jan 2004 to June 2015 (using the trailing 12 month average to focus on the trend) we see ROW decline has been relatively modest (1.4% based on the trailing 12 month output in June 2015). The eight increasing producing countries I have chosen are Brazil, Canada, China, Iran, Iraq, Russia, Saudi Arabia, and US and ROW=World minus the 8 countries just listed.

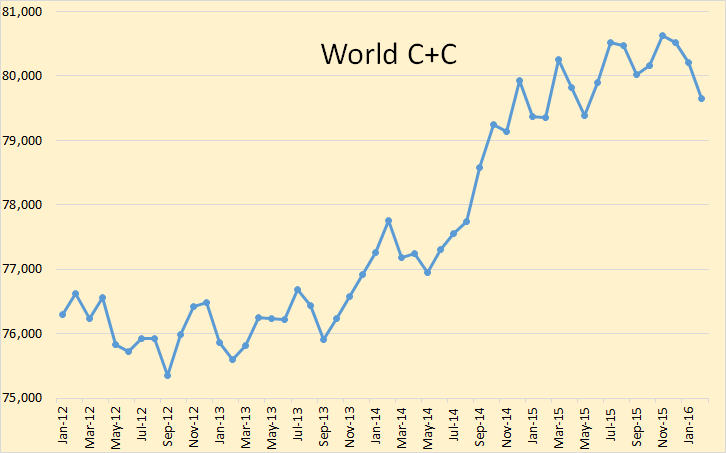
One possible scenario is that output is flat for the Big 8 in 2016 so that World C+C output falls by 485 kb/d in 2016 (average output for the year compared to the 2015 average). Over the 2009 to Jun 2015 period the Big 8 increased output at about 1300 kb/d per year, if we assume this rate slows to half the previous rate to a 650 kb/d per year increase (1.4%/year), then the peak is surpassed in 4 years in 2019. On a per country basis this would be a little more than a 80 kb/d increase in average annual output for each of these countries, though I doubt it would be divided equally.

So I have taken close look Dennis’s “Big 8” countries as well as “The Rest of the World”, and  looked at their JODI data charts. The last data point is October 2015.

First, the rest of the world.

Dennis's Rest of the World

This is the world less Brazil, Canada, China, Iraq, Iran, Russia, Saudi Arabia and the USA. As a group they peaked in October 2004 and have been in decline ever since. They have declined in times of low oil prices and high oil prices. And barring a miracle they will continue to decline.

Read More