The following June OPEC data is based on the latest July OPEM Monthly Oil Market Report and is in thousand barrels per day.
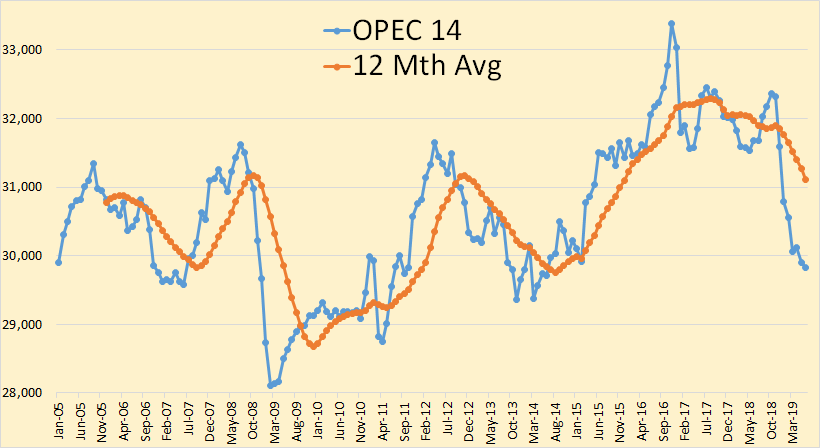
OPEC 14 crude only production was down 68,000 barrels per day in June.
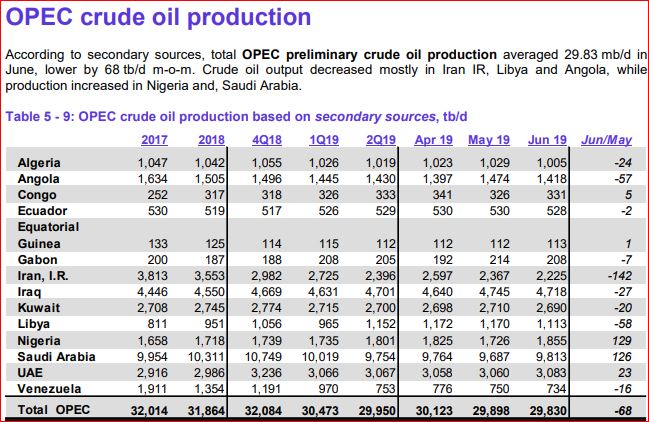
The following June OPEC data is based on the latest July OPEM Monthly Oil Market Report and is in thousand barrels per day.

OPEC 14 crude only production was down 68,000 barrels per day in June.

The data for the charts below were taken from the EIA’s Monthly Energy Review. It is crude plus condensate through March 2019 and is in thousand barrels per day.
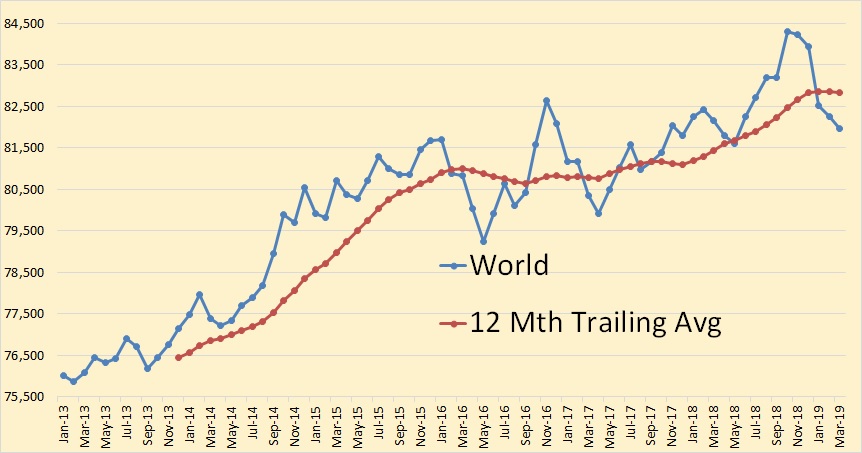
World C+C was down 281,000 barrels per day in March.
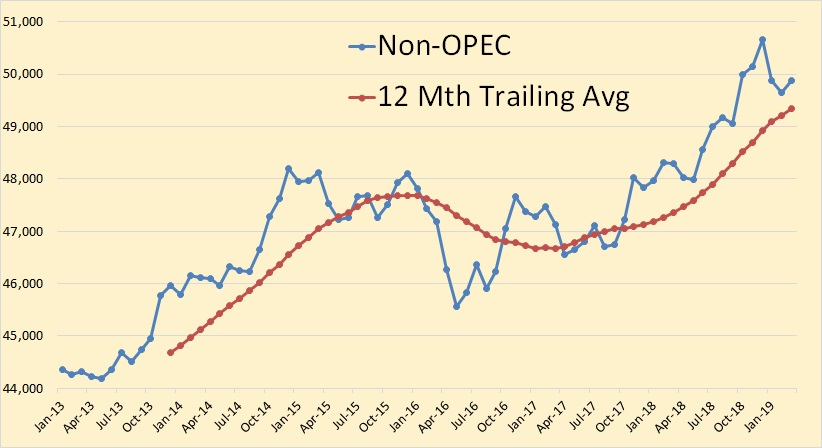
Non-OPEC was up 218,000 barrels per day in March.
The below charts, unless otherwise noted, were taken from the OPEC Monthly Oil Market Report. The data is through May, 2019 and is in thousand barrels per day.
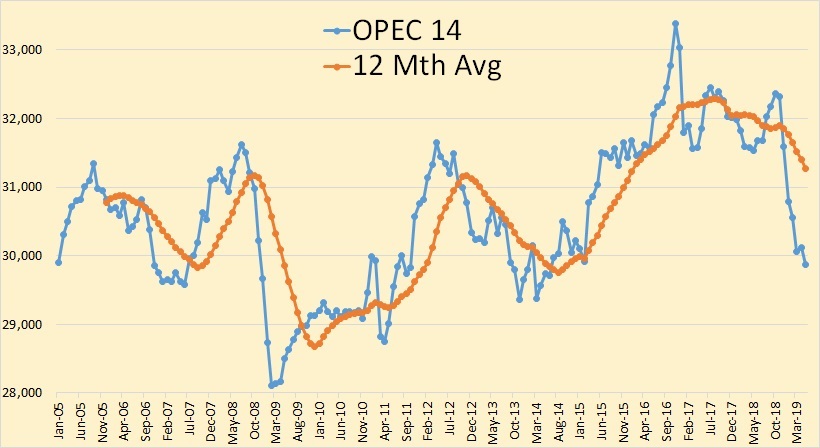
OPEC crude only production was down 236,000 barrels per day in May but that was after April production had been revised upward by 82,000 bpd.

Iranian April production was revised upward by 43,000 bpd and Saudi Arabia April production was revised upward by 24,000 bpd.
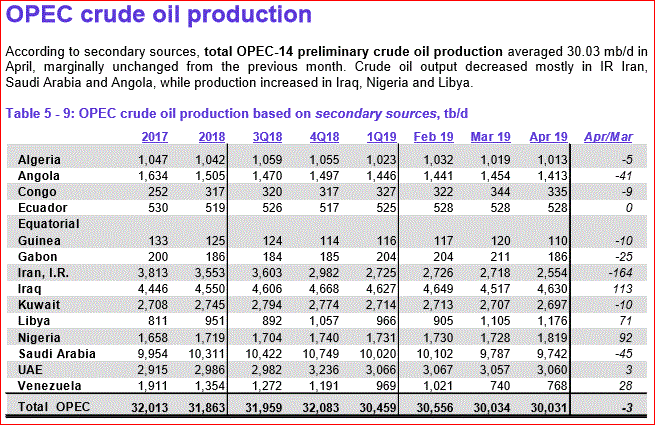
The data below was taken from the OPEC Monthly Oil Market Report. All data is through April 2019 and is in thousand barrels per day. The data is crude only, that is it does not include condensate.

Total OPEC production hardly moved in April, down a mere 3,000 barrels per day.
Comments related to oil and natural gas production and closely related subjects in this thread. Thanks.
“Shale companies from Texas to North Dakota have been managing their wells to maximize short-term oil production. That has long-term consequences for the future of the American energy boom. By front-loading the wells to boost early oil output, many companies have been able to accelerate growth. But these newer wells peter out more quickly, so companies have to drill new ones sooner to sustain their production. In effect, frackers have jumped on a treadmill and ratcheted up the speed, becoming ever more dependent on new capital to keep oil production humming, even as Wall Street is becoming more skeptical of funding the industry.” Rebecca Elliot, The Wall Street Journal (4/8)
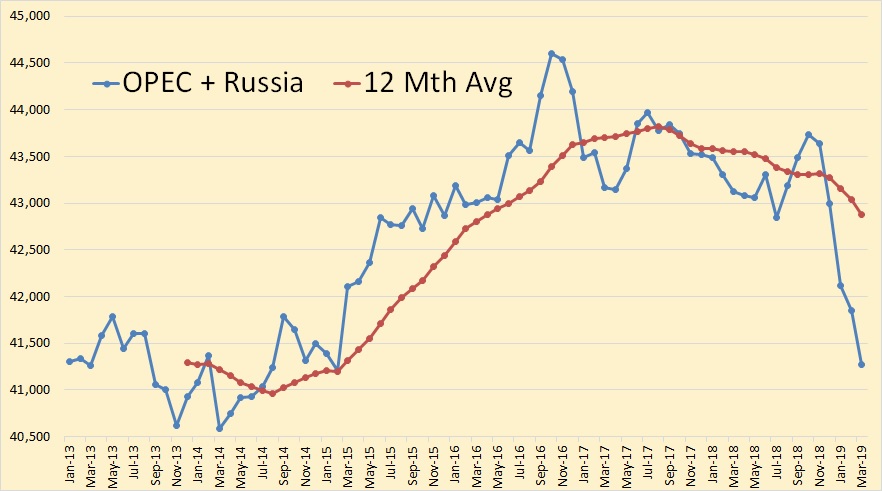
OPEC + Russia through March 2019, in thousand barrels per day.