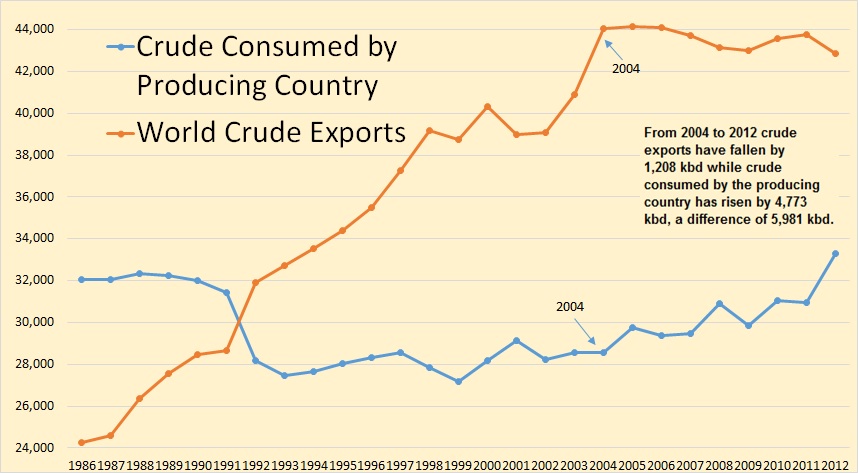
The EIA has updated their International Energy Statistics with annual production numbers through 2014 and export data through 2012. Sometimes these stats can be confusing as they include several types of production and exports. But for production I use only “Crude plus Condensate” and for exports I used “Crude Oil Exports” which I assume includes condensate as well.
Also the export data is not exact, just close, because some importers are also exporters. For instance in 2001 the US exported 59,000 barrels per day. In 2012 the US exported 629,000 barrels per day. The exporting of condensate is allowed in the US and since the Shale boom condensate exports have increased quite dramatically because Light Tight Oil is rather top heavy with condensate.
To get exports versus consumption for exporting nations I simply subtracted their exports from their production. The difference was what they consumed. Similar data can be found on the Energy Export Databrowser.
I think the data clearly endorses Jeffrey Brown’s Export Land Model.
In 2012 76,160,000 barrels of C+C were produced per day. Of that 76 million barrels 42,845,000 barrels were exported while the other 33,315,000 barrels was consumed by the producing nations. That is this is oil that was never exported.
