Non-OPEC Oil Production Starts to Rebound

A post by Ovi at peakoilbarrel

Below are a number of oil (C + C ) production charts for Non-OPEC countries created from data provided by the EIA’s International Energy Statistics and updated to June 2020.  Information from other sources such as OPEC, the STEO and country specific sites is used to provide a short term outlook for future output and direction for a few countries.

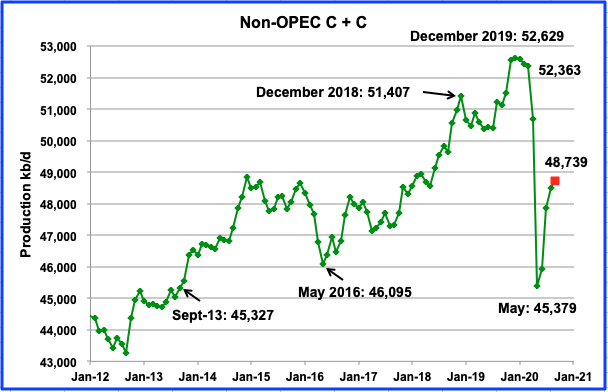
Non-OPEC production has started to rebound from the May low of 45,379 kb/d. According to the EIA, June’s output added 564 kb/d to May’s to end up 45,943 kb/d. Using data from the STEO, a projection for Non-OPEC output was made to September. September output is expected to rise to 48,739 kb/d, with the biggest increment occurring in July, close to 1,000 kb/d. Of the 1,000 kb/d, 500 kb/d will be provided by the US.

Read More

May Non-OPEC Oil Production drops to 2013 levels

A post by Ovi on peakoilbarrel

Below are a number of oil (C + C ) production charts for Non-OPEC countries created from data provided by the EIA’s International Energy Statistics and updated to May 2020.  Information from other sources such as the OPEC and country specific sites is used to provide a short term outlook for future output and direction.

Non-OPEC production dropped slowly from a high of 52,638 kb/d in December 2019 to 52,396 kb/d in March 2020. In April that changed when we saw the first big drop in output from the Non-OPEC countries associated with Covid and with the drop in world oil prices. May output collapsed to 45,340 kb/d, which is close to the production level in September 2013.

Read More

US Production Growth Surges

A Post by Ovi at peakoilbarrel

All of the oil production data for the US states comes from the EIAʼs Petroleum Supply Monthly. In addition, information from other EIA offices is provided to project future US output. At the end, an analysis of a few different EIA reports is undertaken.

The charts below are updated to November 2019 for the 10 largest US oil producing states (>100 kb/d).

The latest data from the January EIA report shows that US production surged by 203 kb/d in November to reach a new high of 12,879 kb/d. Since June the US has increased output by an average of 164 kb/d/mth. Looking forward to December production, the January Monthly Energy Review (MER) estimates US production for December to be 12,861 kb/d, down 14 kb/d from November and shown in red as the last data point.

If the MER is correct for December at 12,861 kb/d, that means that the January 2020 STEO is too high in their output prediction. They estimate December output to be 12,967 kb/d, 106 kb/d too high.

Read More

Non-OPEC Production Growth is Struggling

A Post by Ovi at peakoilbarrel.

Below are a number of oil (C + C ) production charts for Non-OPEC countries created from data provided by the EIA’s International Energy Statistics and updated to September 2019. Information from other sources such as the IEA and OPEC is used to provide a short term outlook for future output and direction.

Non-OPEC production decreased by 22 kb/d from 50,512 kb/d in August to 50,490 kb/d in September. This is another output reduction month in 2019. In 2019 there have been 5 months of decline and 4 months of increases. For comparison purposes, in 2018, there were 9 monthly increases and 3 decreases. This is just another indicator of the increasing difficulty Non-OPEC countries will have boosting output going forward, now that US production growth has started to slow.

September production is just 287 kb/d short of the previous high of 50,777 kb/d reached in December 2018. Will new output from Norway and Brazil, along with small but increasing US output coming in the next few months raise Non-OPEC output beyond the previous December 2018 high?

Read More

Is Non-OPEC Oil Production Recovering?

A post by Ovi @ peakoilbarrel.

Below are a number of oil production charts for Non-OPEC countries, created from data provided by the EIA’s International Energy Statistics and updated to August 2019.  Information from other sources such as the IEA and OPEC is used to provide a short term outlook for future output and direction.

Non-OPEC production increased by 752 kb/d to 50,482 kb/d in August from 49,730 kb/d in July. This is the first significant monthly increase in 2019. Output declined from January to May. The main contributor to the increase was the US by adding 599 kb/d. This leaves August production just 295 kb/d short of the previous high of 50,777 kb/d reached in December 2018. New output from Norway and Brazil, along with increasing US output coming in the next few months could raise Non-OPEC output beyond the previous December 2018 high. The question “How much higher beyond the December high” is of great interest to OPEC+.

Read More