News Bulletin: Caught this on The Motley Fool:
Is Chesapeake’s Reduced Oil Production Growth Forecast Really That Bad?
But the company recently said that its crude oil production growth will slow dramatically this year — an announcement that clearly disappointed investors, judging by the immediate negative impact on Chesapeake’s share price. But is the guidance really that big of a deal?
I couldn’t find anything else about this story. Chesapeake doesn’t have anything in the Bakken but they are big in Eagle Ford. They drilled eight Bakken wells and they were all duds so they pulled out. But is this something that is happening to other Eagle Ford producers?
The notion persist that OPEC has millions of barrels per day of spare capacity and could increase production if only they desired to do so. Many, in fact most people, really believe that all 12 OPEC nations are operating as a cartel and that perhaps all OPEC nations could increase production if they got the word. I think that idea is absurd and only the truly naive and those who know virtually nothing about the history and ability of OPEC could possibly believe such nonsense. And OPEC has done nothing to squash that idea.
OPEC Upstream Spare Capacity
Spare OPEC crude oil capacity is set to stabilize at around 8 mb/d over the medium-term, rising from an average level of around 4 mb/d in 2011.
2011 was the year of the Libyan Revolution. At the beginning of that year three countries, Saudi Arabia, Kuwait and the UAE, combined, did have about 1.6 mb/d of spare capacity. The other eight OPEC countries had none. And by January 2012 all 12 OPEC were producing flat out, in my opinion anyway.
However not everyone believe that OPEC has that much spare capacity.
US oil boom may cushion any Venezuelan supply shock CNBC
“A geo-political risk premium in crude oil prices related to Venezuela is likely non-existent at present,” said UBS commodity strategists Giovanni Staunovo and Dominic Schnider in an email to CNBC on Saturday. “This could change at any time considering OPEC’s spare capacity is between 2.5 and 3.0 million barrels a day and Venezuela produced 2.5 million barrels a day in January. A loss of a large share of this capacity would not pass crude oil prices unnoticed.”
Commodities Now
Using IEA figures for 2013, OECD Europe imported 3.05 Mb/d of crude oil from Russia, or 36% of their net crude oil imports. When refined products, NGLs, and other feedstocks are included, total net oil imports rose to 4.33 Mb/d, or 44%, of OECD Europe’s net oil imports. These volumes far exceed Saudi/OPEC spare capacity of less than 2 Mb/d.
I found many statements on the web talking about how the markets get jittery when spare capacity gets too low and when it gets high they settle down. My question is: <b>How do they know?</b> So let me show you some production charts and see what you think.
EDIT: To those who believe Saudi has spare capacity I would just like to point out that Sadad Al Husseini, a former executive at Saudi Aramco, disagrees with you.
“This is strictly, totally business,” said Sadad Al Husseini, a former executive at Saudi Aramco, the state oil company.
“Saudi production is flat out. Where you send it is a matter of where you make the best profit.”
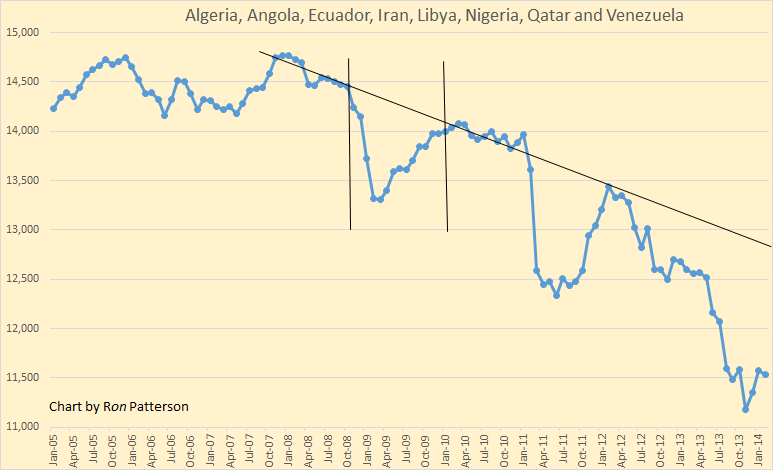
The above eight OPEC countries are clearly in decline. the two vertical lines mark the actual cut in production by OPEC responding to the price collapse in late 2008. One year later all eight nations were producing flat out again. The slanted line shows the actual decline in production for these eight OPEC countries. The end of the line marks the “approximate” spot where their production would be except for the Iran sanctions and the Libyan political problems.
One of those eight, Shell Vice President says that Nigeria, is is steep decline.
Nigeria’s Crude Oil Production Decline Rates Pegged at 20 Per Cent
The Vice President of Shell Upstream International, Mr. Markus Droll has said that decline rates in crude oil production within Nigeria’s hydrocarbon industry can be as high as 15 to 20 per cent.
Droll also said that replacing such natural production decline rates in the industry requires more funds than is currently available and that the peculiar high cost operational environment of Nigeria has further compounded the situation.
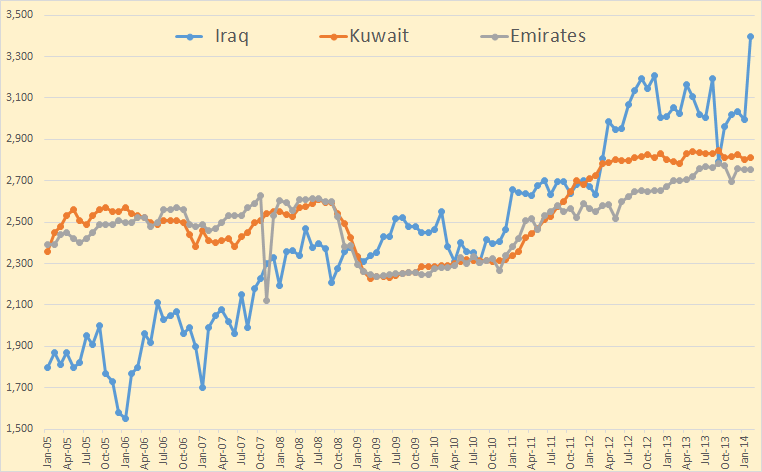
Here are the other OPEC countries with the exception of Saudi Arabia. Iraq has advertised the fact that they want to produce 12 mb/d but they are a long way from that number. But there is no question that they are producing every barrel possible.
Kuwait and the UAW did cut production after the collapse of 2008. And unlike the other eight, they both, along with Saudi Arabia kept those cuts through 2010. Then when the Libyan revolution hit in 2011 they all began to ramp up production as much and as fast as they could. And by 2012 every OPEC nation was again producing flat out.
Read More
