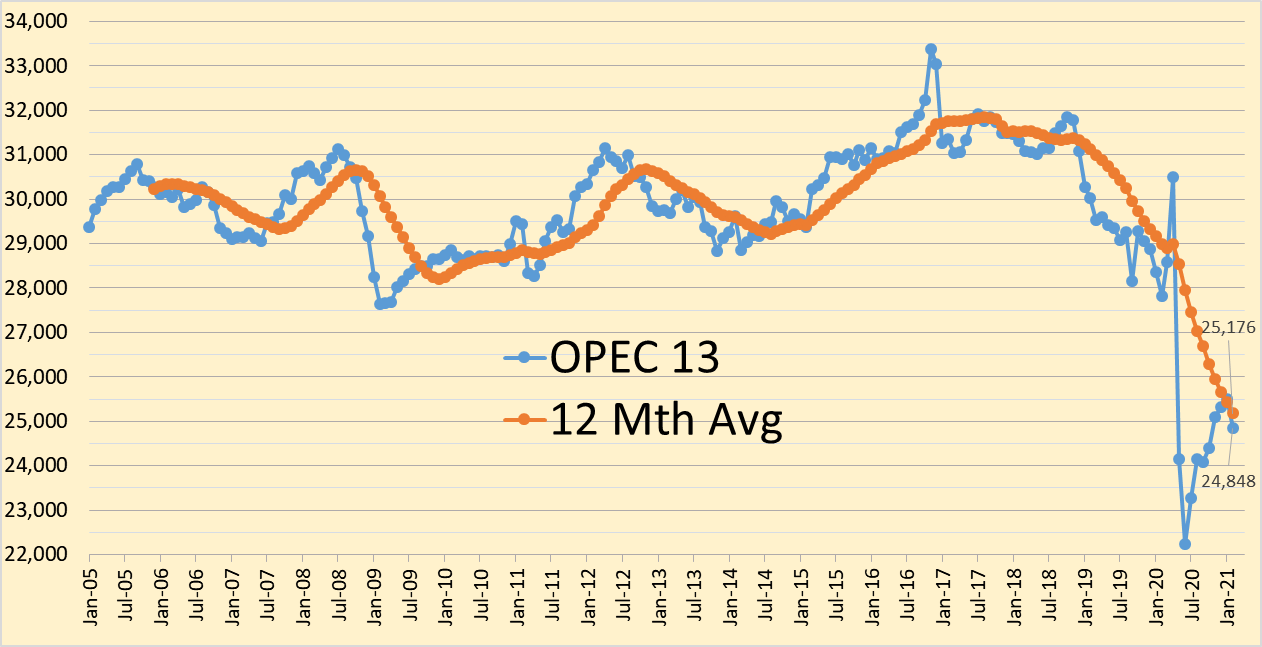
The OPEC Monthly Oil Market Report for March 2021 was published this past week. The last month reported in each of the charts that follow is February 2021 and output reported for OPEC nations is crude oil output in thousands of barrels per day (kb/d). The numbers at the left side of the graphs show February 2021 output (and in some cases the trailing 12 month average output).
Read MoreTag: MOMR
OPEC MOMR, November 2020
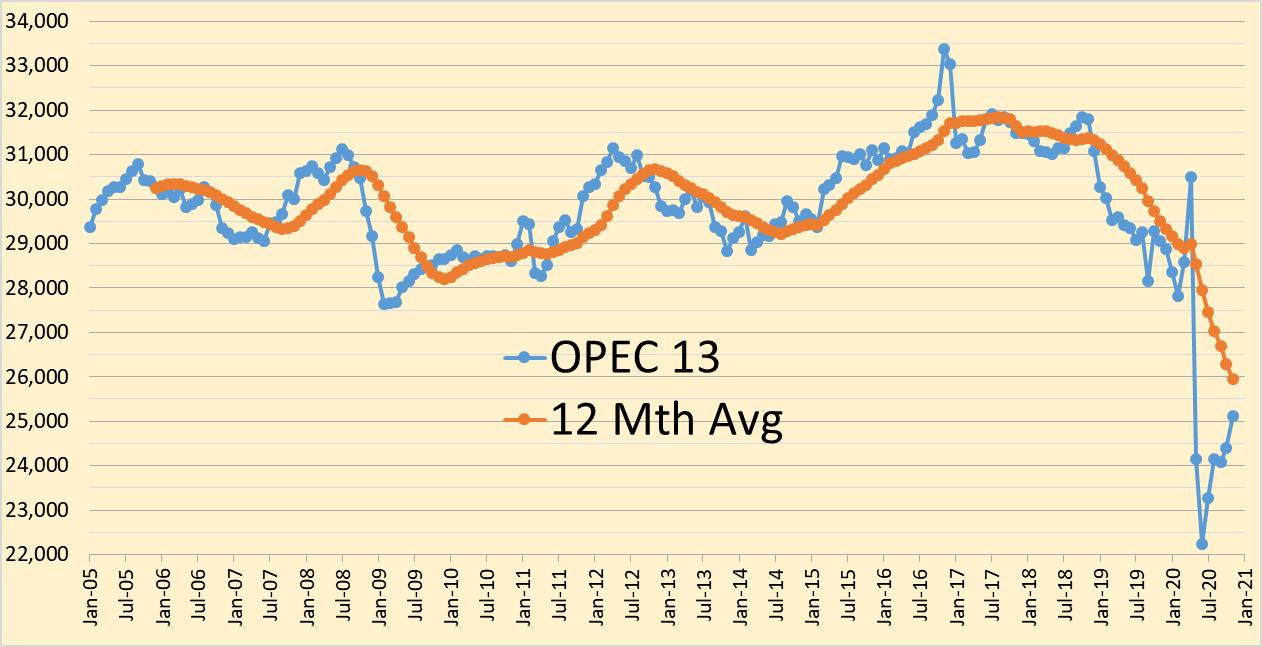
This update reports data from the Monthly Oil Market Report (MOMR) published by OPEC on December 14, 2020. The latest data point in each chart presented is November 2020 and output is thousands of barrels per day (kb/d).
OPEC output in October was revised 14 kb/d higher than reported in the October MOMR to 24,402 kb/d. November 2020 OPEC output increased by 707 kb/d to 25,109 kb/d.
Read MoreOPEC Production EIA Vs. MOMR
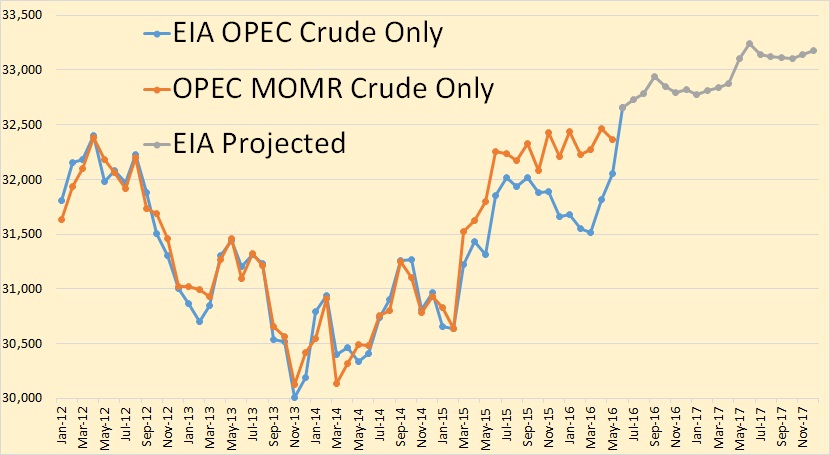
The latest OPEC Monthly Oil Market Report is out with OPEC crude only production numbers for May, 2016. I have compared these numbers with those published by the EIA in their Short-Term Energy Outlook table 3a. All data is in thousand barrels per day and the last data point in May 2016 except for the projection in the one chart below.
The EIA has OPEC crude production up 238,000 bpd in May to 32,052,000 bpd while OPEC’s “secondary sources” has OPEC production down 100,000 bpd to 32,31,000 bpd in May. The MOMR still has their May production 309,000 bpd more than the EIA.
However that all changes next month, according to the EIA. They have OPEC crude production jumping by 600,000 bpd in June to 32,652,000 bpd. They did not project individual countries however so we have no idea where they believe all that oil is going to come from. Frankly, I just don’t believe it is going to happen.
OPEC, except for Iran, Has Peaked
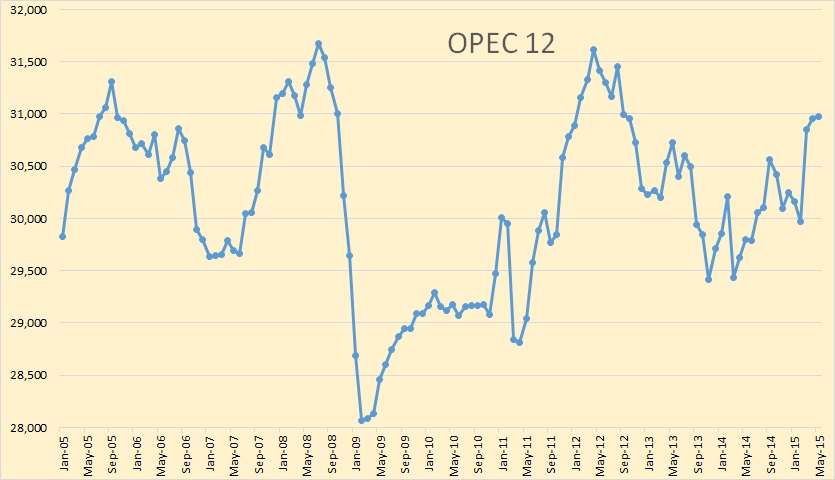
The OPEC Monthly Oil Market Report is out. OPEC took a hit in December, down 205,000 barrels per day. After examining the past and present production numbers, I believe that OPEC, except Iran, has peaked. That is, the combined production from all the other OPEC nations, has peaked. And any additional production from Libya is likely to be in tiny increments that won’t make much difference in the big picture. Other OPEC nations may show a slight increase from their current level. But the combined production from all the other 11 OPEC nations, 12 if you count Indonesia, has peaked.
Of course there will be some small increases from the other 11 OPEC countries from time to time but overall, in 2016 and beyond, I believe it will OPEC will be from flat to down, with a greater chance of being down. That is we are at, or near, the peak right now. There might be a slight uptick of their combined production in the coming months but not enough to get excited abut.
All Data in the charts below is through December and is in thousand barrels per day.
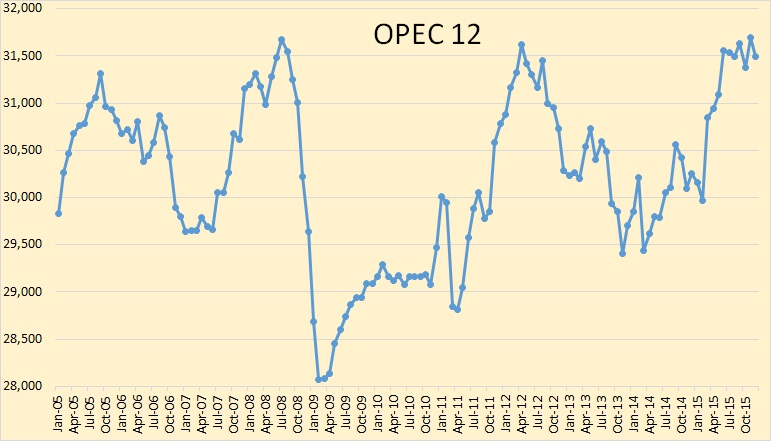
OPEC production, in the chart above does not include Indonesia. OPEC 12 was down 204,000 barrels per day.
OPEC + Different EIA Data
The latest OPEC Monthly Oil Market Report is out. There were no big surprises.
OPEC crude only production was up 23,000 bpd in May but that was after April had been revised upward by 110,000 bpd.
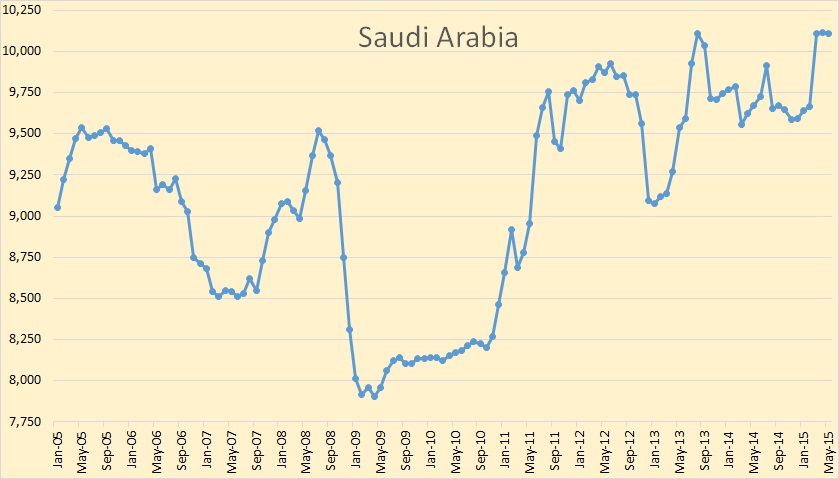
Almost no change is Saudi production, down 5,000 bpd to 10,107,000 bpd.