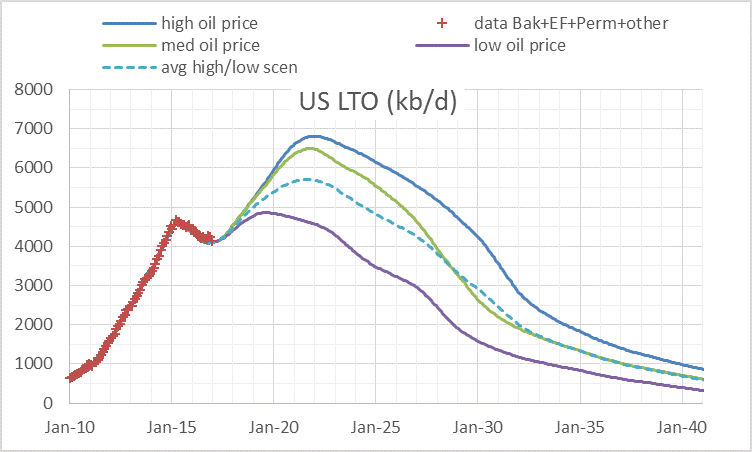
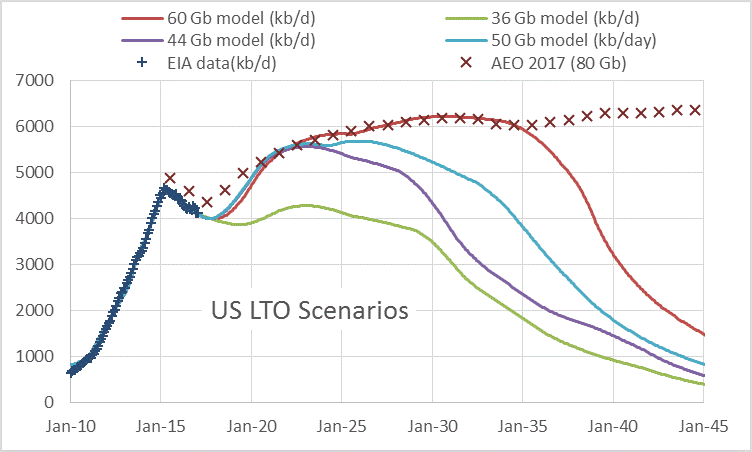
The future output from the light tight oil (LTO) sector of the US oil industry is the subject of much speculation. Above I present some possible future output scenarios based on a simple model of US LTO, the scenarios are compared with the EIA’s 2017 Annual Energy Outlook (AEO) reference scenario with cumulative output of 82 Gb from 2001 to 2050. The cumulative output of the model scenarios is for the same period (2001-2050). Read More
Tag: LTO
Is The Bakken a Bust?
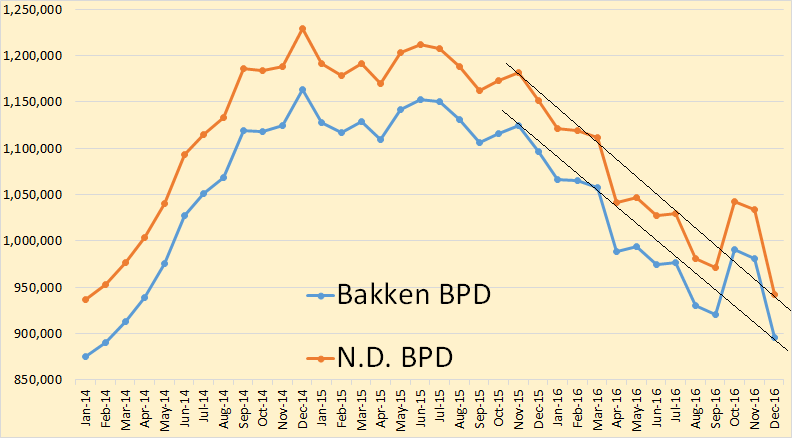
North Dakota has released December production data for the Bakken and for all North Dakota. They were a little shocking.
Bakken production down 86,150 barrels per day 895,330 bpd. North Dakota production down 92,029 bpd to 942,455 bpd. It was noted that this the largest decline ever in North Dakota production. But it should not be overlooked that the October in crease in production was also the largest ever increase in North Dakota production.
Eagle Ford and World Update-Nov 2016
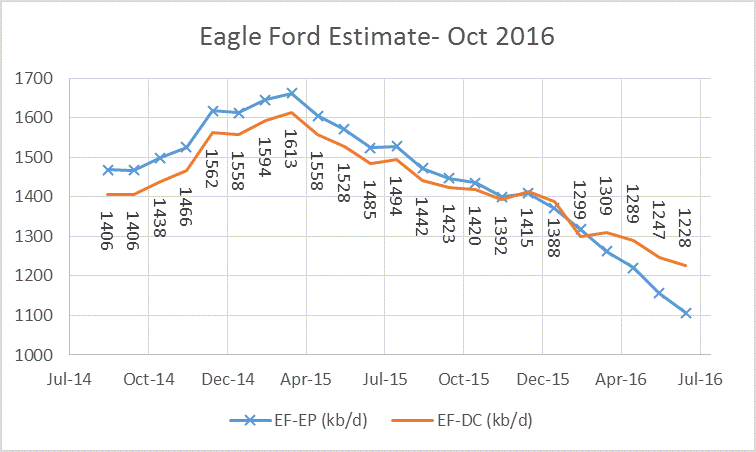
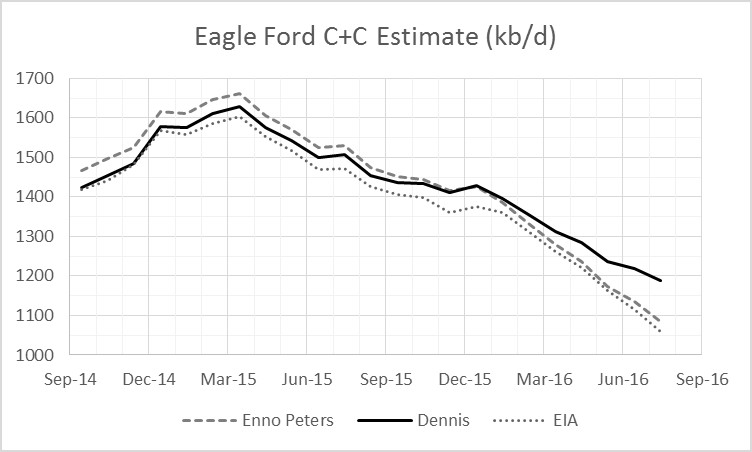
Enno Peters recently reported on Eagle Ford output at shaleprofile.com, so I have updated my estimate of Eagle Ford output by utilizing his data. Enno reports horizontal well output from the Eagle Ford region so some output from other formations is included (Austin chalk, etc). To compensate for this I compare the data from shaleprofile to the output reported from the EIA for the Eagle Ford.
For Sept 2014 through Nov 2015 Enno’s data is about 52 kb/d higher on average each month than the EIA estimate, so I deduct this amount from my preliminary estimate to arrive at my final estimate. Enno’s data for each month from Sept 2014 to July 2016 is divided by Texas (TX) statewide C+C output from the RRC to find the percentage of Eagle Ford region to TX statewide output. This percentage is multiplied by Dean Fantazzini’s 6 month corrected estimate of Texas C+C output and then 52 kb/d is subtracted to arrive at my final Eagle Ford estimate.
The Chart below has my estimate labelled as Dennis and Enno’s Eagle Ford region estimate (horizontal wells only) labelled as Enno Peters. The EIA estimate is shown as well.
Eagle Ford Output Estimate and Future Scenario
Eagle Ford output is difficult to estimate as there are 20-25 separate fields that need to be followed to get a full picture. To save time, I have used Enno Peters’ data for horizontal wells from Districts 1 to 5 in Texas from his website shaleprofile.com, he has data through June. Enno’s data is combined with the RRC data for statewide C+C output to find the percentage of Texas C+C from the Eagle Ford. This percentage is multiplied by Dean’s estimate for Texas C+C output to get the following estimate, which is compared with Enno Peters’ data. EF-EP is Enno Peter’s collection of data from the RRC, EF-DC is my estimate using the method described. Based on a May 2016 Eagle Ford estimate, I subtract 70 kb/d from the EF-DC estimate to account for non-Eagle Ford horizontal well output in Districts 1 to 5
North Dakota Bakken/Three Forks Update
The North Dakota Industrial Commission (NDIC) reported June crude plus condensate (C+C) output on August 12, 2016. North Dakota(ND) Bakken/Three Forks (BTF) output fell by 20.46 kb/d in June to 973.86 kb/d. Overall ND C+C output fell to 1026.58 kb/d in June, a decrease of 185.2 kb/d in the past 12 months. Based on data from Enno Peters, 43 new wells started producing oil in June 2016.
I pulled the charts below from shaleprofile.com (Enno Peter’s website).