Oil Price Volatility and US EIA Data

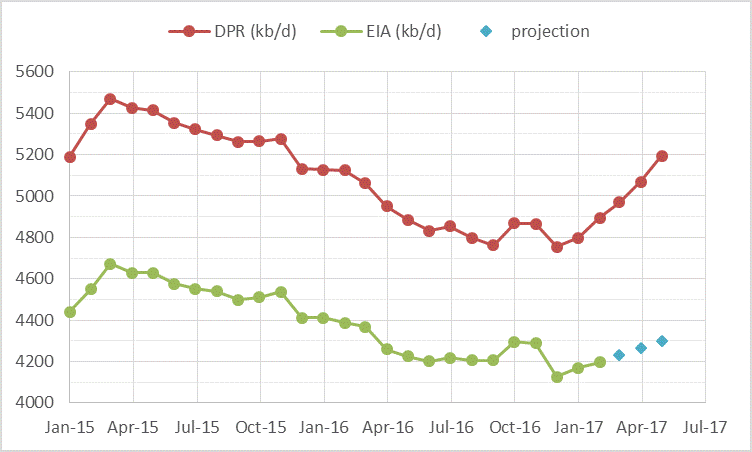
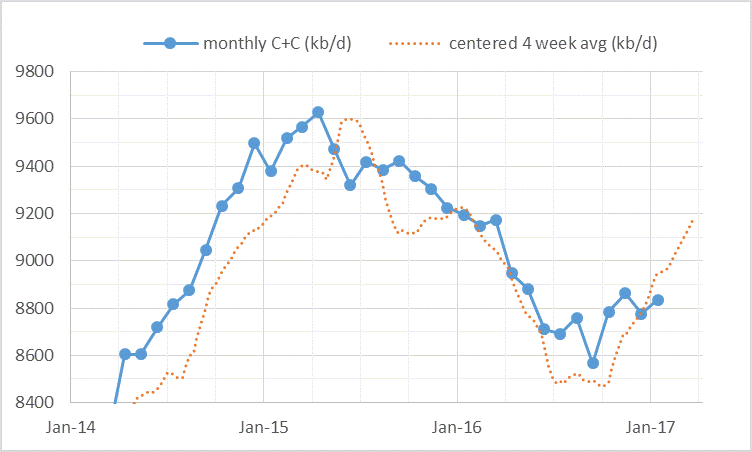
A number of news media pieces have recently suggested that oil prices may fall due to soaring output in the US.  Output from US light tight oil (LTO) may not rise as quickly as some EIA reports may suggest. One source of confusion is that the EIA creates many reports and some are more reliable than others. The two charts below cover US LTO and US crude plus condensate (C+C) output.

US LTO Output from the EIA Drilling Productivity Report (DPR) and EIA Tight Oil (LTO) estimates in kb/d.

chart/

US EIA monthly C+C output and centered 4 week average output in kb/d.

chart/

Read More

Texas and Eagle Ford Update April 2017

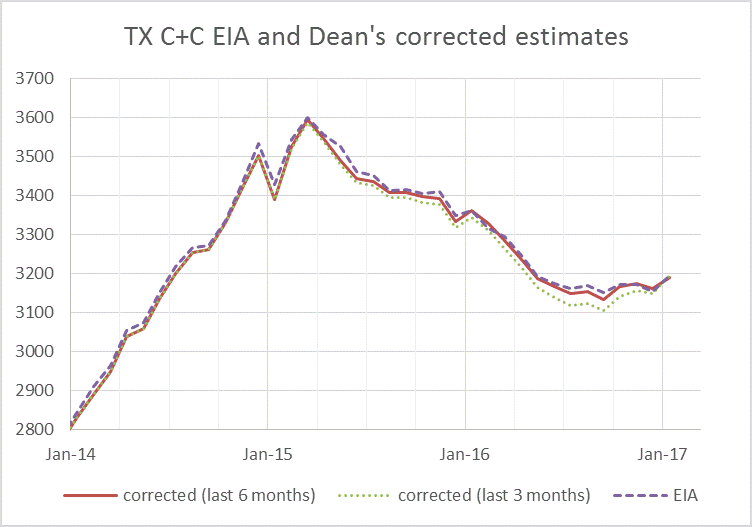
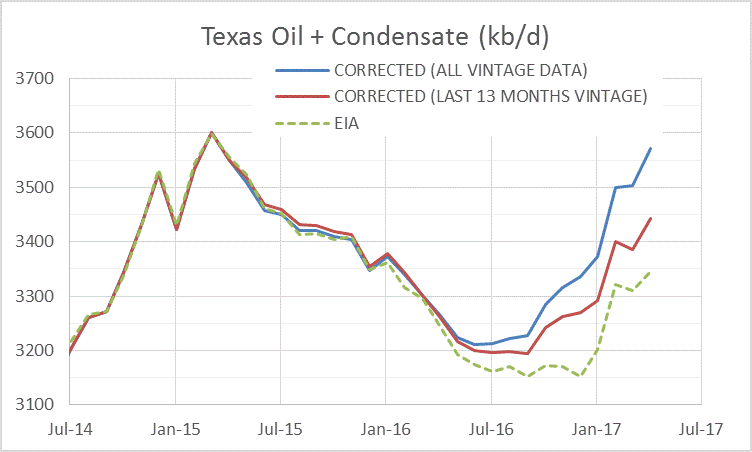
Dean Fantazzini recently updated his estimates for Texas Oil and Natural gas. Data from the Texas Railroad Commission has improved so correction factors are smaller, the estimates from Dean now match the estimates by the US EIA fairly closely for Crude plus condensate (C+C) produced in Texas.
There was a noticeable change in the Texas data about 6 months ago so I show an estimate based on the correction factors from the previous 6 months. Dean prefers to show an estimate based on all the data (which he has done for many months) and an estimate based on the most recent 3 months of data (which has been presented more recently). The EIA estimate is more consistent with the 3 month or 6 month estimate with the “all vintage data” estimate being somewhat higher.

chart/ Read More

World Oil Production

A guest post by David Archibald

The views expressed in this post do not necessarily reflect the views of Dennis Coyne or Ron Patterson.

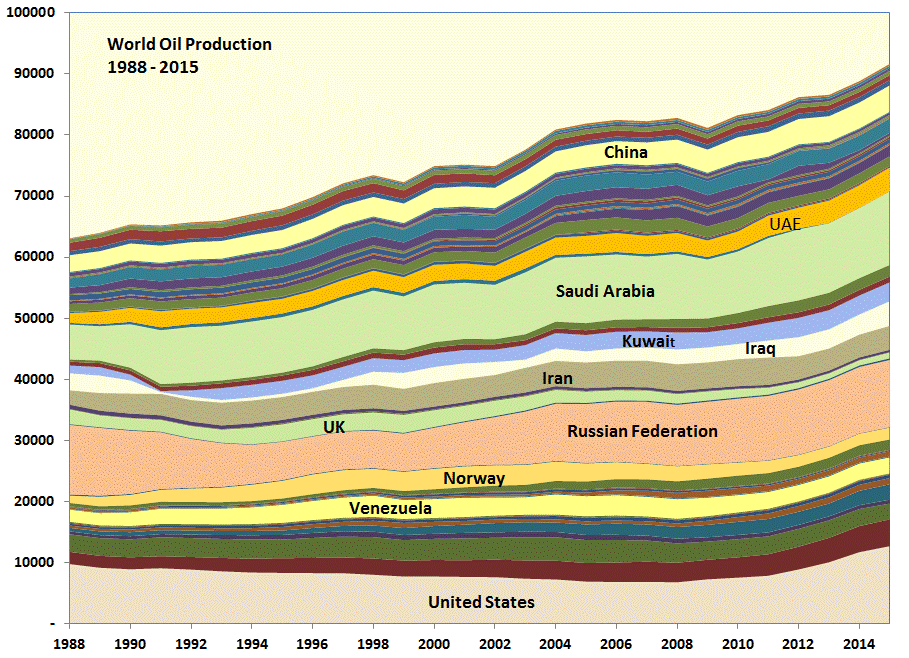
The BP Statistical Review of World Energy has oil production data by country up to the end of 2015. This is what that looks like from 1988:
chart/

The United States increased production by 5.1 million barrels per day from 2010 to 2015. The increase in production from countries around the Persian Gulf over the same period was slightly less at 5.0 million barrels per day. The increase in total world production was 8.4 million barrels per day so the rest of the world declined by some 1.7 million barrels per day. This was despite Canadian production rising 1.0 million barrels per day from oil sands developments plus some other increases from Russia, Brazil, Colombia etc. Most oil producing countries are in well-established long term decline or plateau at best. How these trends will interact can approached from a bottom-up basis. To that end, the following graphs show likely production profiles by region for the next five years. Read More
Future US Light Tight Oil (LTO) update

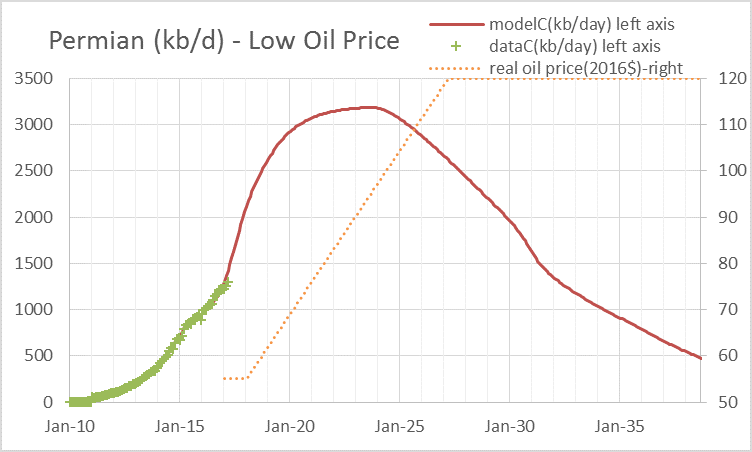
In a previous post on US LTO future output there were suggestions that a bottom up approach might be better than the top down approach and I agree. I will attempt the bottom up approach here. The chart below is a quick summary, based on three different oil price scenarios (high, medium, and low). The dashed line is just the average of the low and high oil price scenarios. Data is from Enno Peters’ website shaleprofile.com and the EIA. (Click on “Tight Oil Production Estimates” for tight oil output data.)

chart/

Read More