North Dakota Bakken/Three Forks Update

The North Dakota Industrial Commission (NDIC) reported June crude plus condensate (C+C) output on August 12, 2016. North Dakota(ND) Bakken/Three Forks (BTF) output fell by 20.46 kb/d in June to 973.86 kb/d. Overall ND C+C output fell to 1026.58 kb/d in June, a decrease of 185.2 kb/d in the past 12 months. Based on data from Enno Peters, 43 new wells started producing oil in June 2016.

I pulled the charts below from shaleprofile.com (Enno Peter’s website).

bakchart/

Read More

Texas Petroleum Report – July 2016 and LTO scenarios

by Dennis Coyne

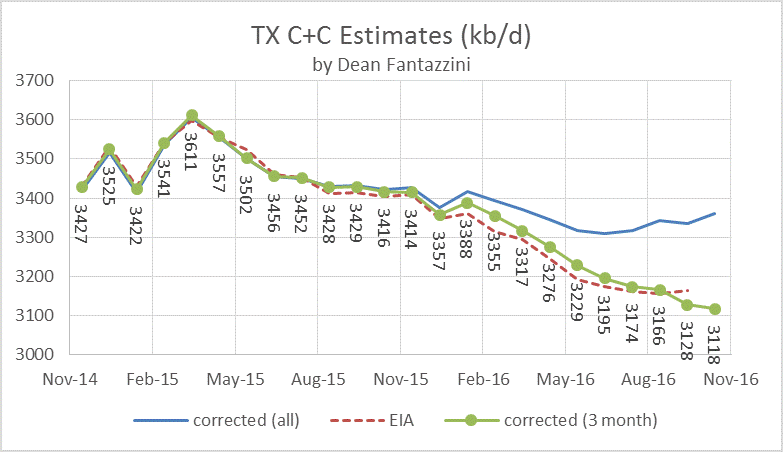
I have attempted to correct the reported Texas output using the methodology provided by Dean. Usually Dean provides the spreadsheets and I simply reproduce his charts with a few comments.  This month Dean may be on vacation or busy and I have not yet received his input. If I get his charts I will post them.

Dean uses the average of the correction factors from Jan 2014 to the present in order to reduce the month to month volatility of the correction factors.  I tried several averaging methods (all data, 12 month average, 6 month average, and 3 month average) where for the x month average the most recent x months of correction factors were averaged.

The only method with a significant difference was the 3 month average, so I present the “corrected” output using Dean’s usual method and an “Alt (3 month)” alternative. The RRC data and the EIA estimate are also included for reference.

TX/

Read More

North Dakota Production and STEO

The Bakken and North Dakota production data is out.

Bakken & North Dakota

Bakken production was up 6,540 barrels per day while all North Dakota production was up 5,383 bpd. This was not posted as a correction to last months data though it looks that is exactly what it is. Last months data was twice as much as it should have been so now it is correct. Notice the data from the Drilling Productivity Report. It appears to have June data exactly correct, or very nearly so. Of course that is all the Bakken, including the Montana Bakken.

Read More

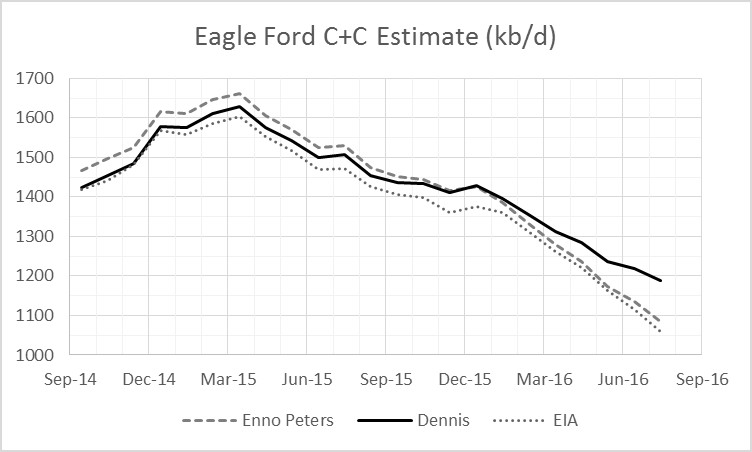
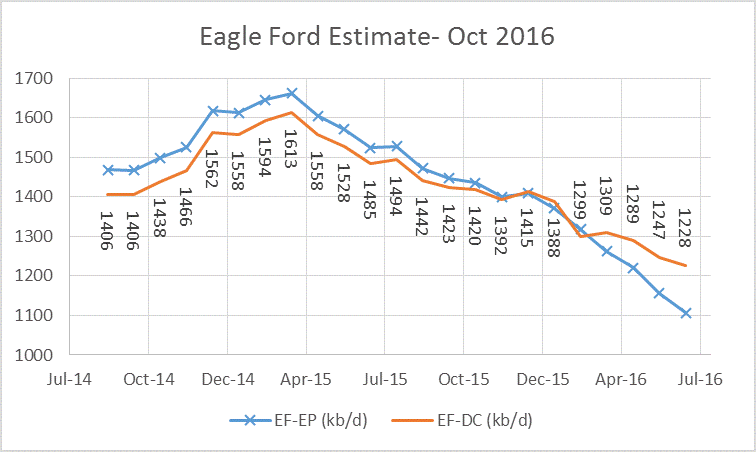
Petroleum Supply Monthly, Texas C+C estimate, Permian, and Eagle Ford

This post was written by Dennis Coyne and does not necessarily reflect the opinion of Ron Patterson.

I have considered an alternative way of estimating Texas oil (C+C) output using the Drilling info data provided in the EIA’s 914 monthly production reports.

TX/

The Texas estimate is a weak part of the EIA’s estimate for US C+C output. In the chart above I show the EIA’s most recent monthly estimate from the Petroleum supply monthly and compare with an alternative estimate that substitute’s my best estimate for EIA’s TX C+C estimate. The slope of the trend line needs to be multiplied by 366 to give the decline at an annual rate, for the EIA estimate it is 528 kb/d per year, and for the alternative estimate it is 364 kb/d per year. Read More