Short Term Energy Outlook, March 2025

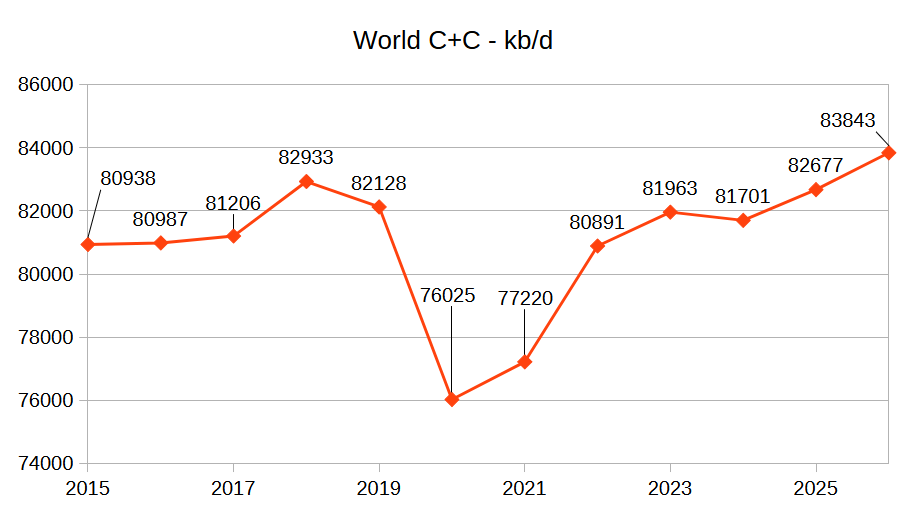
The EIA Short Term Energy Outlook (STEO) was published recently. An estimate for World C+C output from 2015 to 2026, with forecast values for 2024 to 2026 based on the recent STEO n chart below. A slightly different methodology was used this month by looking at World C+C minus US C+C from the EIA’s International Energy Statistics and World crude minus US Crude as reported in the STEO to find World minus US condensate output. The trend for the condensate data from 2018 to 2023 was used to project condensate from 2024 to 2026 for World minus US and then the forecast for US C+C was added to the World minus US crude forecast along with the condensate forecast to arrive at World C+C.

Read More

Short Term Energy Outlook, February 2025

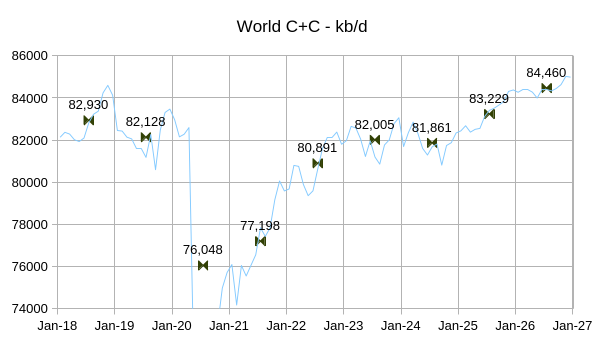
The EIA Short Term Energy Outlook (STEO) was published recently. An estimate for World C+C output from November 2024 to December 2026 is presented in the chart below. This estimate is based on crude oil estimates in the STEO for OPEC12 nations, OPEC+ minus OPEC12 nations, and US C+C estimates and the trend in the ratio of the STEO crude estimates and C+C estimates from the EIA’s International Energy Statistics for OPEC12, OPEC+ minus OPEC12, and non-OPEC+ minus US C+C output from November 2018 to October 2024. For the next 4 charts the horizontal and vertical scales are the same, with 9 years on the horizontal axis and 12000 kb/d from the lowest to highest values on the vertical axis so the differences in rates of change are easier to compare. The thin line represents monthly data or forecasts after October 2024 and the markers with labels show the average annual output for each year.

Read More

U.S. November Oil Production Drops to Year Ago Level

By Ovi

All of the Crude plus Condensate (C + C) production data, oil, for the US state charts comes from the EIAʼs Petroleum Supply monthly PSM which provides updated information up to November 2024.

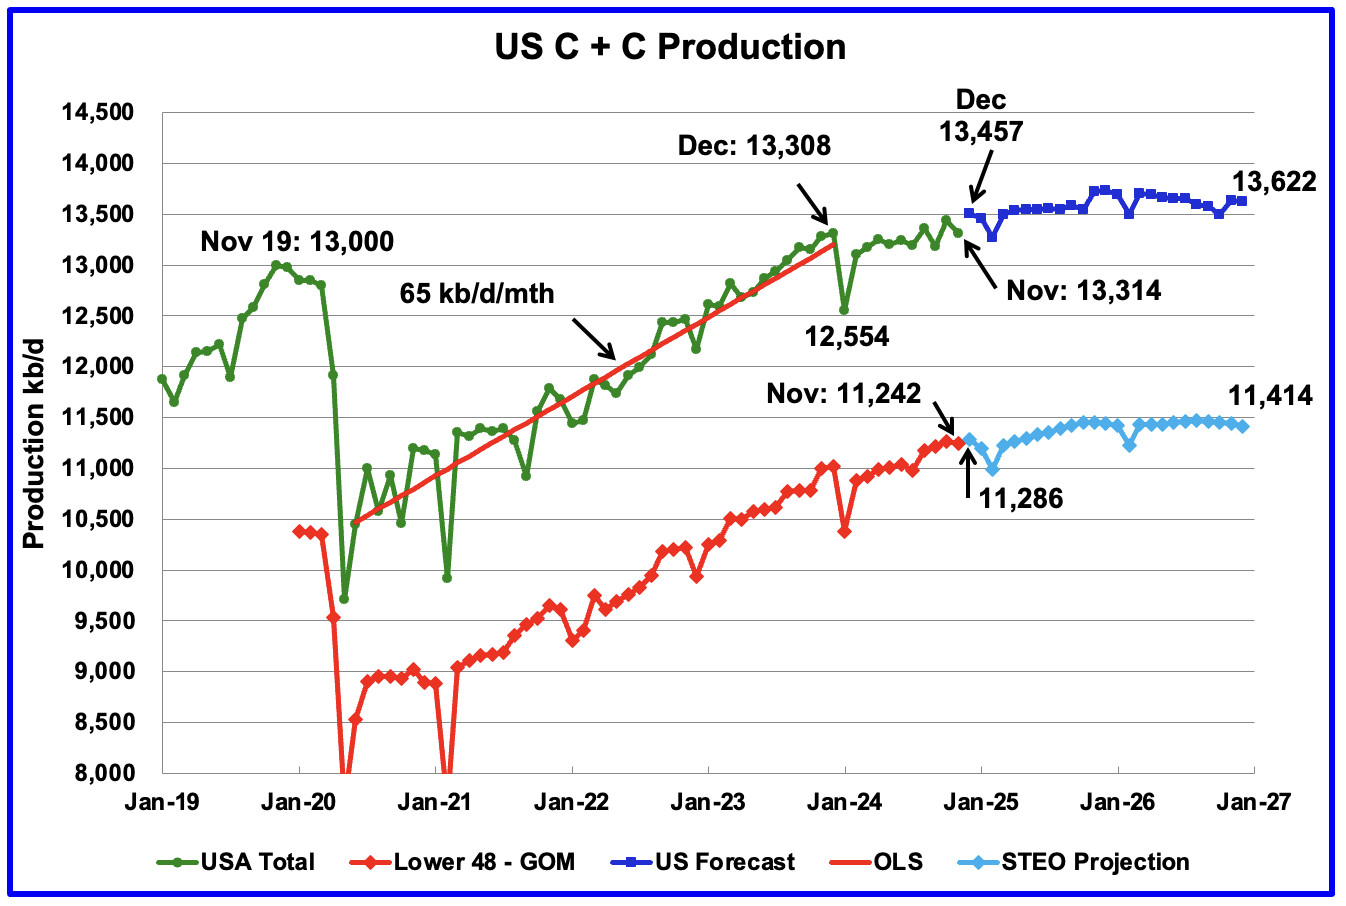
U.S. November oil production decreased by 122 kb/d to 13,314 kb/d, only 6 kb/d higher than December 2024. The largest decreases came from Texas, 70 kb/d, New Mexico 38 kb/d and the GOM 108 kb/d.

Read More