OPEC Production Still Increasing

The July OPEC Monthly Oil Market Report is out with all OPEC Crude Only production data for June 2015.

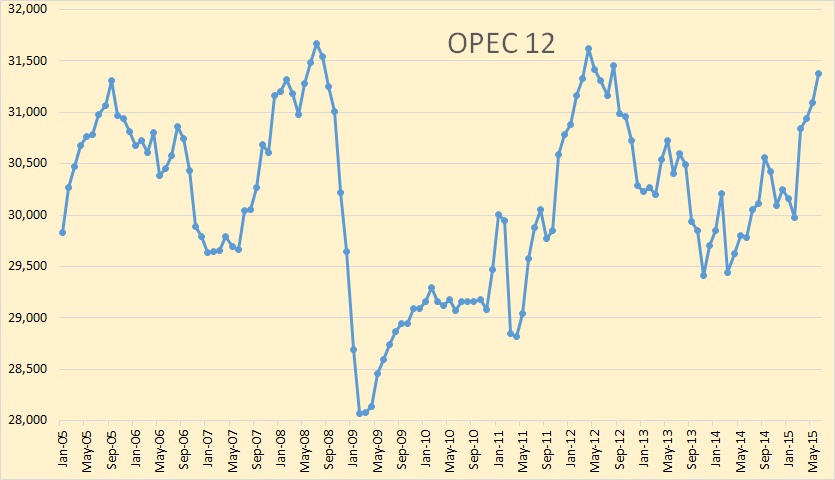
OPEC 12

Crude Only production for the entire OPEC 12 as up 283,000 barrels per day in June to 31,378,000 bpd. But that was after May production had been revised up by 120,000 bpd. So counting May’s revisions and June’s numbers, OPEC production was up 403,000 bpd from what was originally reported last month.
Read More

OPEC according to the EIA

OPEC publishes monthly production data for all OPEC nations in their Monthly Oil Market Report. The data crude oil production only and does not include condensate. I have found the data to be highly accurate and any errors are corrected in the next month’s report or the month following that. The OPEC data is from OPEC’s “Secondary Sources”.

The EIA also publishes OPEC production data in their International Energy Statistics. However the EIA does not publish crude only data. Their data includes condensate.

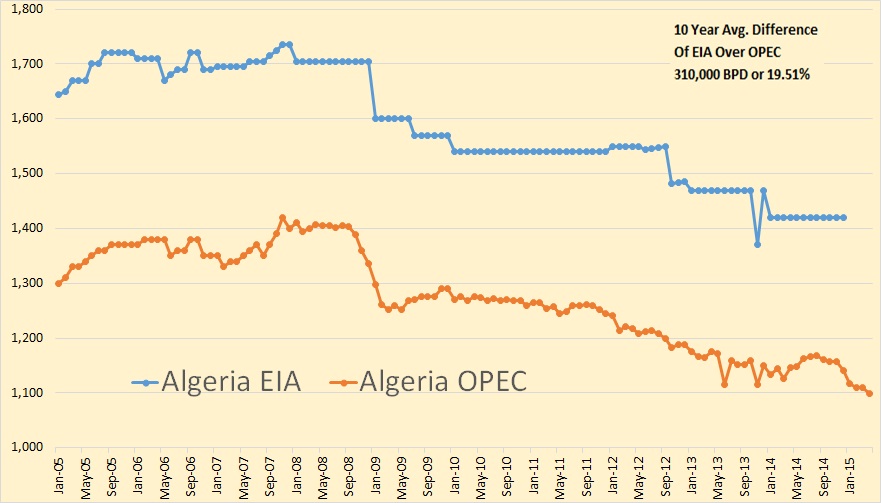
All data is in thousand barrels per day. The last EIA data point is December 2014 and the last OPEC data point is April 2015.

O v E Algeria

Almost 20% of Algeria’s production is condensate if the EIA is correct. Algeria does produce a lot of condensate but I have serious doubts about the accuracy of the EIA data. As you can see from the chart the EIA has Algeria’s production absolutely flat for 24 months, from January 2010 through December 2011. But both the EIA and OPEC agree on one point, Algeria is in decline.

Read More

International Oil Rig Counts

All rig count data is provided by Baker Hughes. All monthly charts are oil rigs only. Gas rigs are not included in the count. The last data point for all monthly charts is April 2015.

When I talk about “peaks” in this post I am only speaking of the peak since 2011 and am not suggesting that there were not higher peaks in previous years.

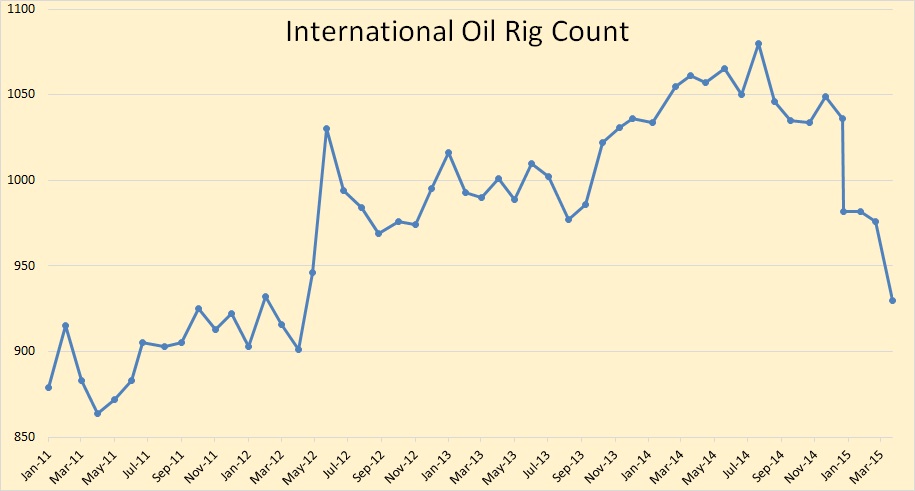
International Oil Rig Count

The International Rig Count has fallen by 150 rigs, from 1,080 in July 2014 to 930 in April 2015. This count does not include the USA, Canada or any of the FSU countries.

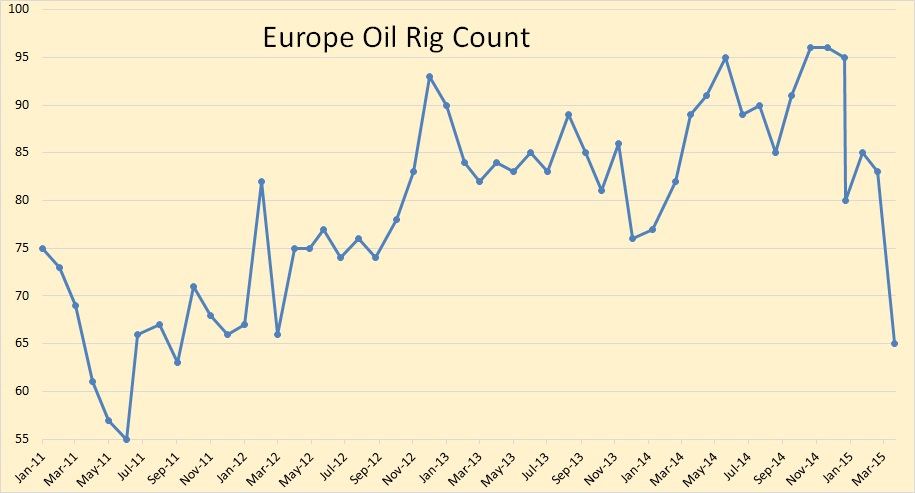
Europe Oil Rig Count

The European Oil Rig Count dropped from 96 in October and November to 65 in April.

Read More

US January Production Data + Neutral Zone

The latest Petroleum Supply Monthly is out with the USA production numbers for January 2015. The data is thousand barrels per day with the last data point January 2015.

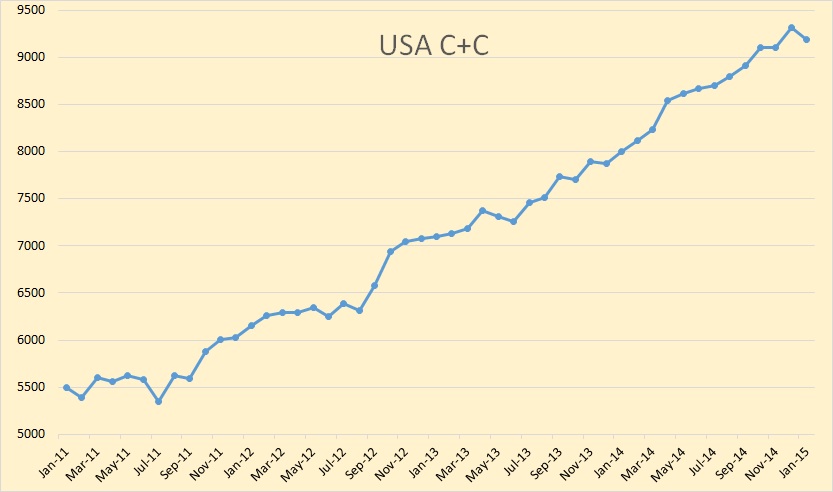
USA C+C

US C+C production was down 135,000 barrels per day in January. That is the biggest monthly decline since July of 2011.

I have shortened the states data to 25 months in order to give more emphasis on the January 2015 data.

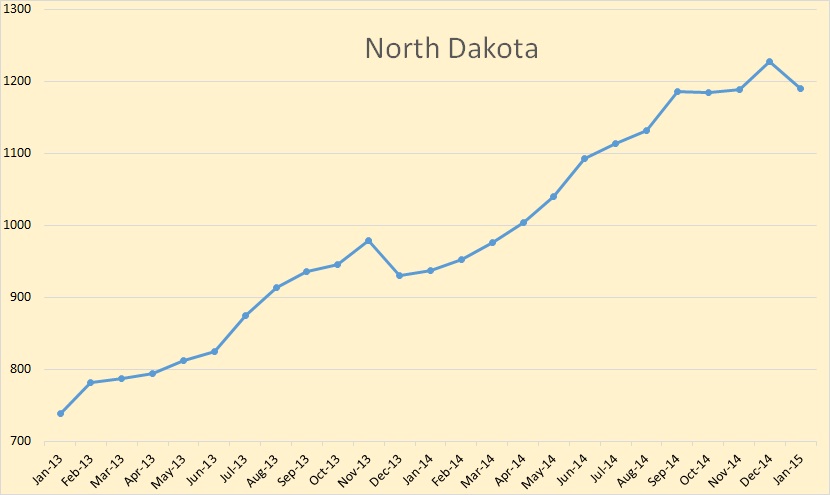
North Dakota

North Dakota was down 37,000 barrels per day, exactly what the NDIC reported. That is because the EIA gets their data from the states.

Read More

JODI, Iraqi Reserves and Ghawar

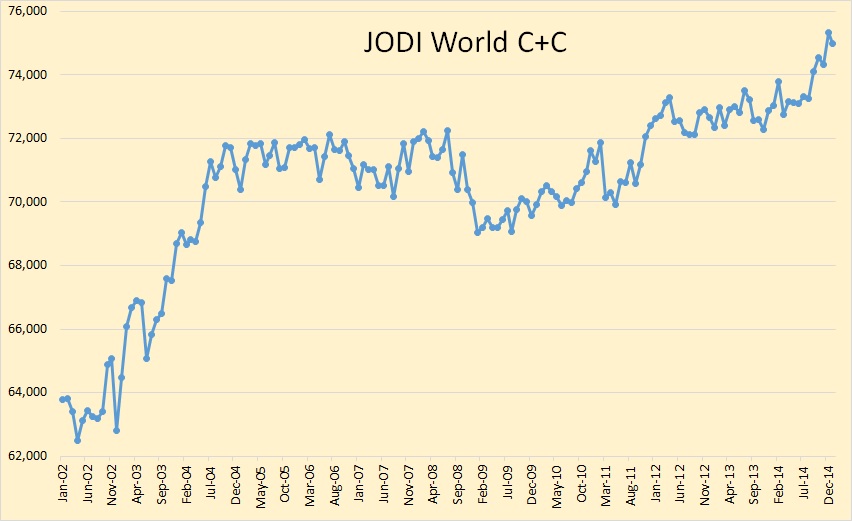
The JODI data just came in with production numbers for January 2015. I really don’t like JODI all that much but they are about two and one half months ahead of the EIA with their world data. And their data is incomplete so I have to substitute the EIA data for the countries that do not report to JODI. So the data I use is about 95% JODI and about 5% EIA. The last data point is January 2015 and is in thousand barrels per day.

JODI World

We peaked in December at 75,342,000 bpd but dropped 356,000 bpd in January to 74,986 bpd.

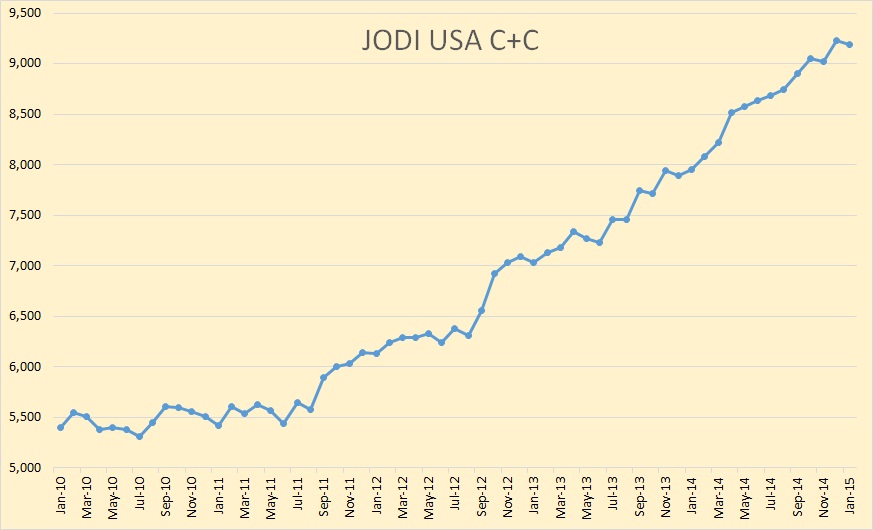
JODI USA

JODI has the US at 9,226,000 in December but dropping 34,000 bpd in January to 9,192,000 bpd. The US did not start its grand ascent until the summer of  2011 when the shale oil boom exploded.

Read More