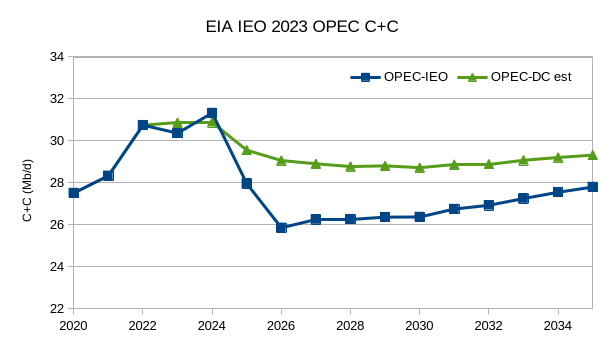
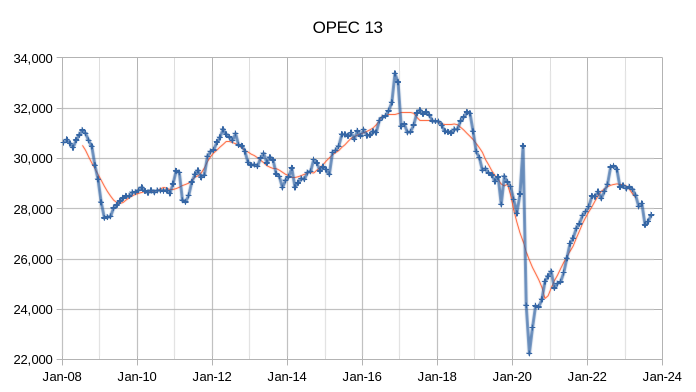
The OPEC Monthly Oil Market Report (MOMR) for October 2023 was published recently. The last month reported in most of the OPEC charts that follow is September 2023 and output reported for OPEC nations is crude oil output in thousands of barrels per day (kb/d). In many of the OPEC charts that follow the blue line with markers is monthly output and the thin red line is the centered twelve month average (CTMA) output. The charts for the International Energy Outlook (IEO) will report crude plus condensate (C+C) output with annual output estimates up to 2035.
Tag: International Energy Outlook
The EIA’s International Energy Outlook 2014
Last year I posted a lot of data published in the EIA’s Annual Energy Outlook 2014 published in May of last year, and the next one is due out Tuesday April 14. We are looking forward to that. But the EIA’s International Energy Outlook 2014, published last September, completely slipped by me. How did I miss that? But I looked at their predictions for world Crude plus Condensate production I found it very interesting.
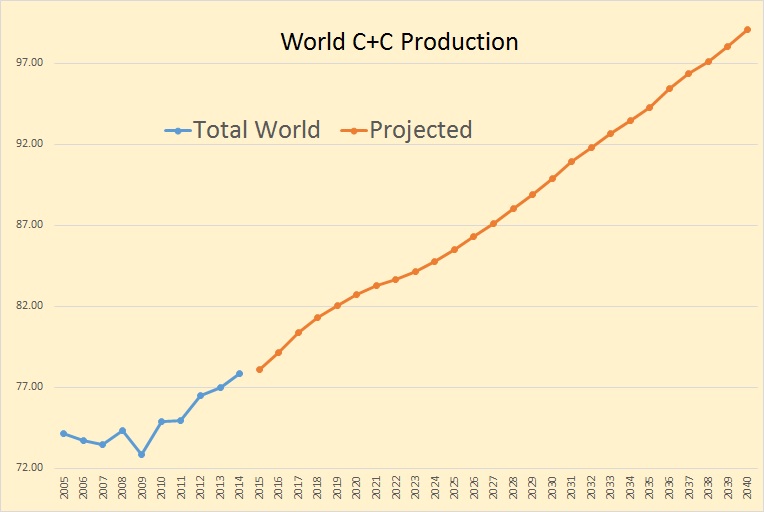
In the below, though the data was posted in September, I have assumed the 2014 data was complete. Though it may be a little off it is close enough for, as the saying goes, “government work”‘. The data is in million barrels per day with the last data point 2040.
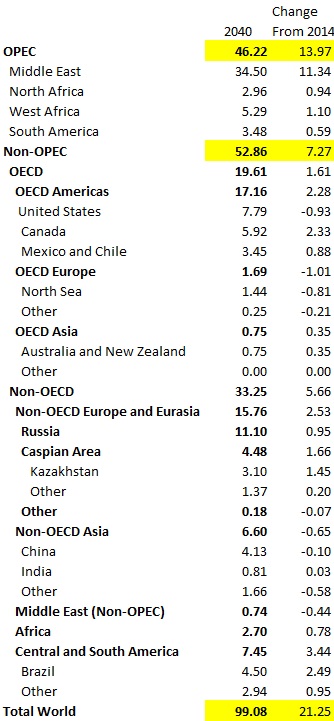
The EIA is expecting World C+C to reach just over 99 million barrels per day in 2040. That will be up 21.25 million bpd from 2014.
This chart shows just which countries, they believe, will be responsible for that 21.25 million bpd increase. That is except for OPEC. They do not break out OPEC production by country.