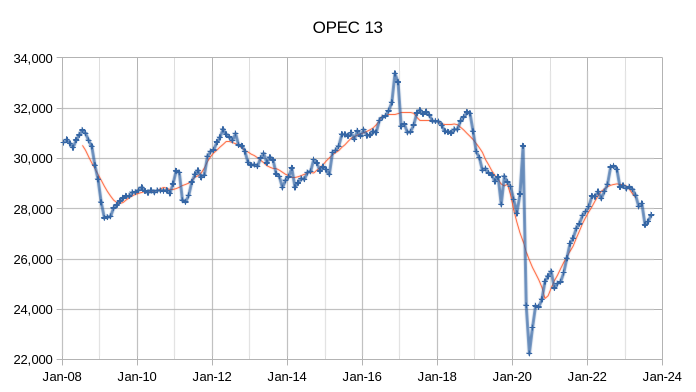
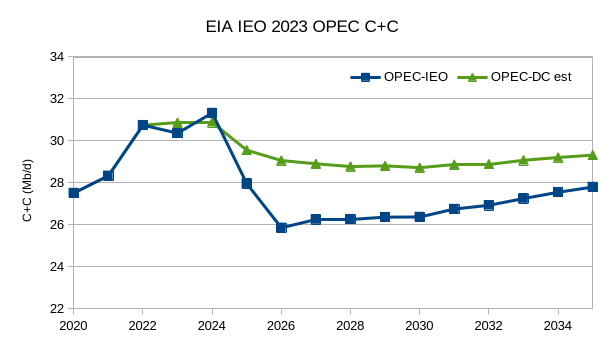
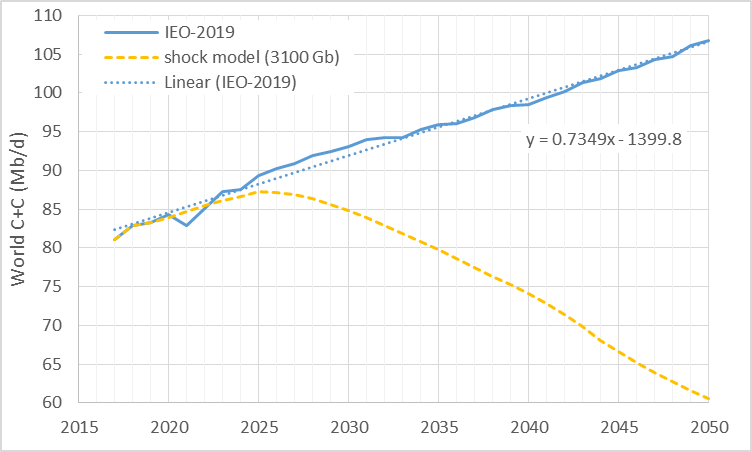
The OPEC Monthly Oil Market Report (MOMR) for October 2023 was published recently. The last month reported in most of the OPEC charts that follow is September 2023 and output reported for OPEC nations is crude oil output in thousands of barrels per day (kb/d). In many of the OPEC charts that follow the blue line with markers is monthly output and the thin red line is the centered twelve month average (CTMA) output. The charts for the International Energy Outlook (IEO) will report crude plus condensate (C+C) output with annual output estimates up to 2035.


