EIA Petroleum Supply Monthly

The EIA has released its Petroleum Supply Monthly with C+C production numbers through May 2014. Of all the EIA data releases this seems to be the most accurate. However in some cases it is only as good as a few EIA employees guesses. And the more state data they have to work with, the better their guess.

The data in this report goes back to 1920 for total US production and to 1981 for individual states and offshore production. However I have chosen to shorten the time frame for my charts in order to better show what has happened recently.

USA

US production was down 36,000 bp/d in May to 8,357,000 barrels per day. US production took off in mid 2011 when Shale production took off and has risen some 3,300,000 since. Of course there was shale production prior to this but it was only keeping US production on a relatively flat plateau.

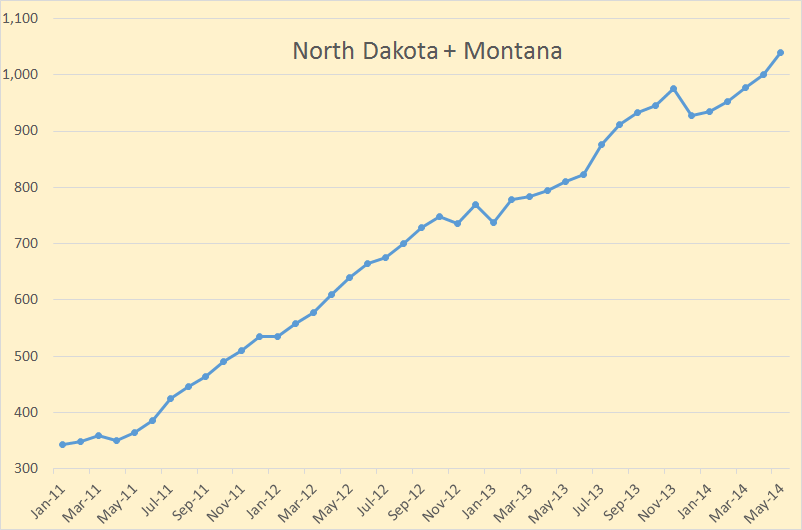
ND and Montana

Everyone is interested in the Bakken so I have combined the two Bakken states. Of course there is production in these two states outside the Bakken but this is the best I could do. Note that when the Bakken has one bad month as they had in December, it takes several months to get back to their prior production level.

Read More

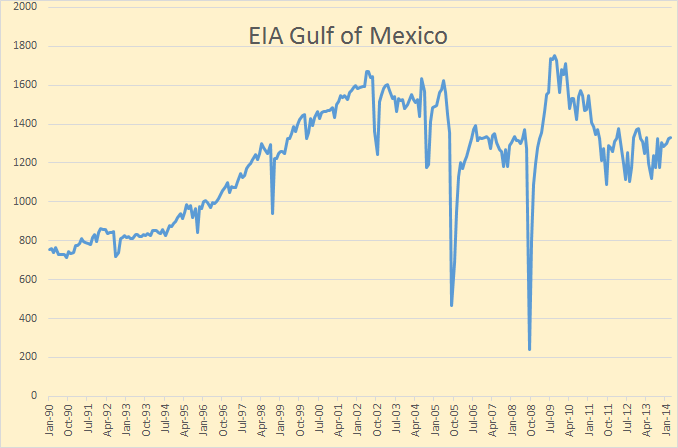
Gulf Of Mexico Crude Oil Production

Folks who follow this blog know that I am a data hog. That is I track data from the US as well as production from the rest of the world. But there are periods during the month when there is just no new data coming in. During the first 10 days or so of a month is such a time, almost no new data is posted anywhere. So I try to find something else to post. It is on the oil production in the Gulf of Mexico.

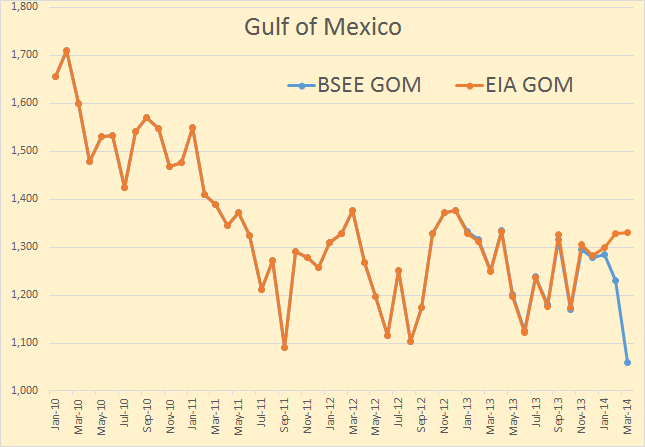
The last data point on all charts is March 2014. All data is in barrels per day except the first chart below which is in thousand barrels per day.

GOM Production

The EIA gets their data from BSEE, (Bureau of Safety and Environmental Enforcement), a branch of Department of the Interior, not the Department of Energy as you might expect.

GOM BSEE

The BSEE is a little like the Texas RRC, that is they report the data they have even though they know it will be revised later. The EIA on the other hand, estimates where they think the data will be after it has all come in. So the chart above shows where they think production in the GOM will be after all the data comes in.
Read More