Peak Oil and The Blibbit Principle

Podunk was a small town Arkansas. Back about a hundred years ago Podunk had no sewage plant, everyone just used outdoor toilets. But a problem soon developed, Podunk’s water supply became contaminated. That’s when they decided to build a blibbit* in which they would store their crap. This blibbit was built out of wood and placed on a hill in a convenient location, right in the middle of town.

The blibbit was almost circular, about 100 feet in diameter. Poles, similar to utility poles, were placed in the ground about 10 feet apart and boards were nailed to them to form the sides up to about 10 feet high. Then every few days everyone in town would haul their crap to the blibbit and dump it in. After a few years the blibbit was full so they added a few more boards to raise the sides higher.

But then someone noticed that the bottom boards were bulging out and appeared about to rupture. “She’s gonna burst” the person shouted to everyone in town. “Nah, maybe it will hold a bit more” was what most people said.

Then a few years later the blibbit was full again so they nailed a few more boards a little higher up on the poles and continued to dump in their crap. The bottom boards became even more strained and looked like they would pop this time for sure. “She’s gonna burst” a couple of more people started yelling. Naw, that’s what you said five years ago you were wrong. So we should not listen to you.

Then about five years later the blibbit became full again. More boards were added and more crap was dumped in. “She’s gonna blow this time for sure. The blibbit has reached peak crap for sure.” “Listen stupid”, was the reply, “that’s what you said 10 years ago, then again 5 years ago, and you were dead wrong. “And because you were wrong in the past means you have to be wrong now.”

Now here is my question: Because the peak blibbit crap people were wrong in the past, does that mean it is more likely they are wrong now? Or, is it even more likely they are right now because the situation has deteriorated even more since the early days of peak blippit crap predictions?

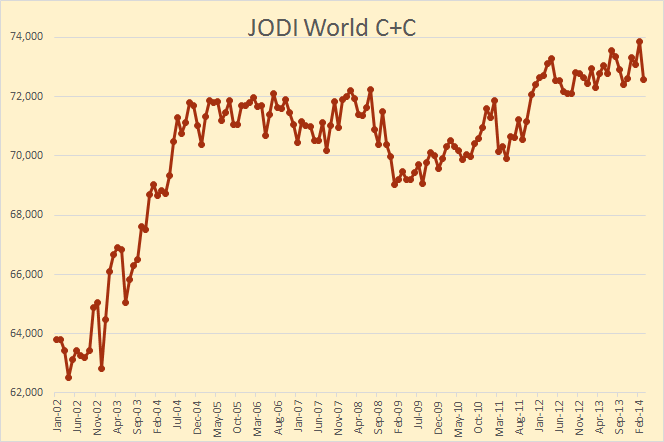
We are all asked, from time to time, what do we think is going to happen to this or that down the road. No one gets asked that question more than peak oilers. And every peak oiler seems to have a slightly different opinion. I have, in the past, reframed from making predictions as to when crude oil extraction will peak. I did so out of fear that I would be wrong and cornucopians would throw it up to me later. But I have now gone out on a limb and now predict that Crude Oil, or rather C+C will peak no later than 2017. I strongly believe the peak will be in 2016 but it could be a year or two earlier but no later than 2017.

World

In spite of all the hoopla about the US shale boom world C+C has been relatively flat for two years.

Read More

The EIA’s Drilling Productivity Report, Ghana and China

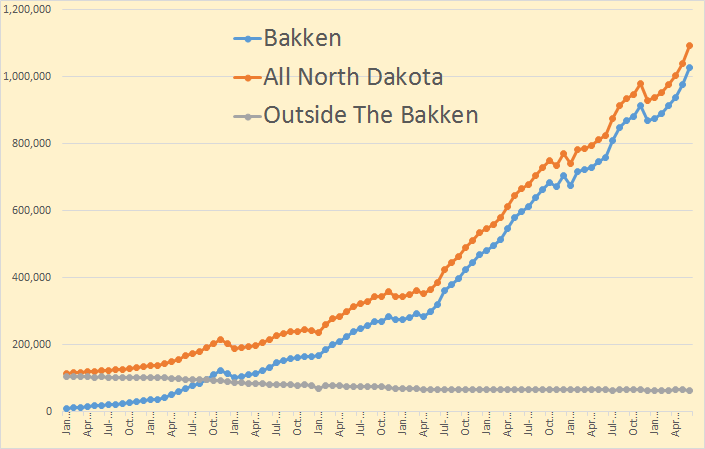
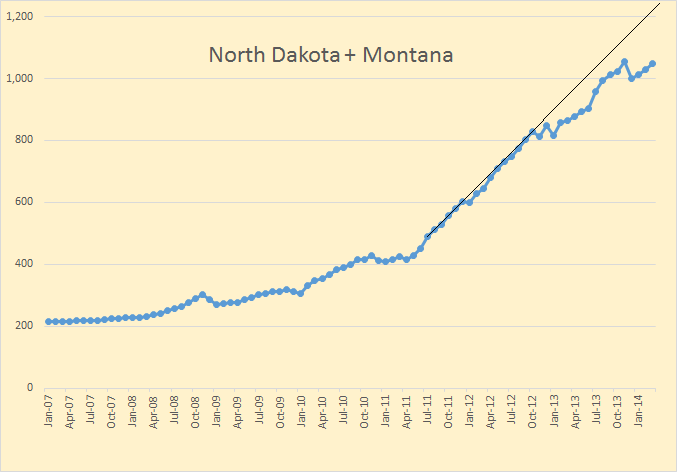
The EIA’s latest Drilling Productivity Report has been published. I found some strange things in the report. For the Bakken, their data does not jive with that posted by North Dakota. I have plotted the two together. The North Dakota includes all North Dakota but not the Montana part of the Bakken. The EIA data includes all the Bakken but not the non-Bakken part of North Dakota. Almost a wash but not quite. Montana produces slightly more than the non-Bakken part of North Dakota, but not very much. Anyway…

EIA New Bakken Report

I thought for sure that the EIA would hear that Bakken Production was down about 50,000 barrels per day in December. But Nooooo… they have the Bakken up by over 20,000 barrels per day in December, a difference of 70,000 bp/d. But up until the last two or three months they follow the North Dakota data pretty close so we can hope they update their data in a few months.

However all LTO production was revised upward in this last report. The chart below is the barrels per day that all tight oil was revised upward.

April Revisions

Doesn’t the strange shape of that chart raise suspicions? December production was revised upward by 34,672 bp/d when it actually should have been revised downward by perhaps twice that amount. January production was revised upward by 35,243 barrels per day. I doubt very much that this was the actual case.

Read More

Update: North Dakota Bakken Data

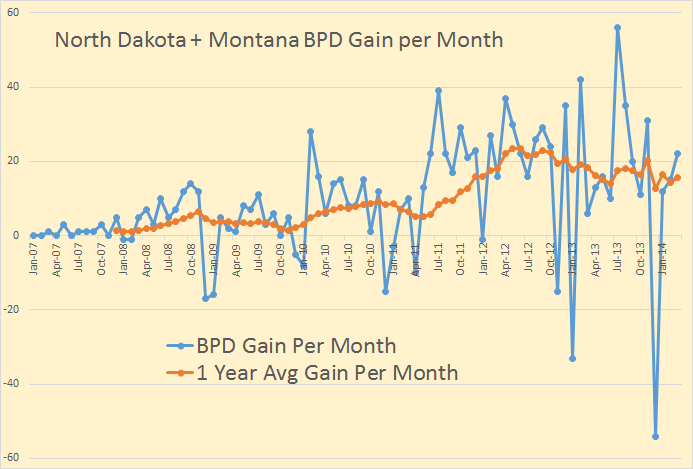
North Dakota published their monthly report on Bakken Production and All North Dakota Prouction. Nothing to get excited about. Bakken production was up 28,285 barrels per day while all north Dakota was up 27,864 barrels per day. This means that North Dakota production outside the Bakken was down 421 bp/d.

The Director’s Cut comments on the price they are getting for Bakken Oil:

Oct Sweet Crude Price = $85.16/barrel
Nov Sweet Crude Price = $71.42/barrel
Dec Sweet Crude Price = $73.47/barrel
Today Sweet Crude Price = $71.25/barrel (all-time high was $136.29 7/3/2008)

Interesting that they are selling their oil at about a $21 discount to WTI about a $35 discount to Brent. More of the Director’s comments:

The drilling rig count was unchanged from Oct to Nov, but the number of well
completions dropped from 166 to 138. Days from spud to initial production remained
steady at 114. Investors remain concerned about the uncertainty surrounding federal
policies on taxation and hydraulic fracturing regulation. 

We estimate that at the end of Nov there were about 510 wells waiting on completion
services, an increase of 50.

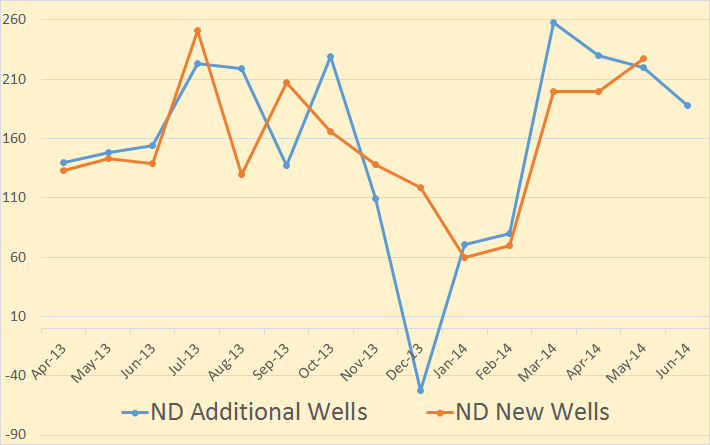
This plot is “Bakken Additional Wells” and the 12 month trailing average. As you can see the average for the last 15 months or so has been pretty flat, around 150 additional wells per month.

Bakken Additional Wells


Read More

The EIA’s Latest Drilling Productivity Report

The EIA’s latest Drilling Productivity Report is out. Not a lot of changes since we now know that the EIA just guesses at the production for the last five months, August through December, then plugs in their estimate for the next two months, January and February. In the case of the Bakken they say December production was 1,003,578 bp/d and January and February will be 1,025,634 and 1,050,521 bp/d respectively. For Eagle Ford December production, they say, was 1,221,576 bp/d and they expect January and February production to be 1,251,617 and 1,285,224 bp/d respectively.

The below chart shows the Bakken production change from month to month. I have shortened the time displayed in order to better show the month to month change.Bakken Change

Notice the dramatic change in the January report for May, June and July. Obviously they looked at the real data and saw how different it was from what they had previously just plugged in, and made the necessary changes. They are saying that the Bakken had a really good December, slightly better than January, then things turn up again in February.

Here is the same chart for Eagle Ford.

Eagle Ford Increase

Not such dramatic changes in the Eagle Ford production data. But notice they are expecting an upturn in January and December. We shall see.

Read More

GOM Production and Other News

Not much happening on the Peak Oil front these days. I checked out the BSEE Gulf of Mexico production. Data is in kb/d with the last data point September 2013.GOM Production

Average production from the GOM has been relatively flat for the last two and one half years at about 1.260 million barrels per day. The arrow marks April 2010, the month of the Deepwater Horizon disaster.

The big deepwater plays continue to decline. I guess they are bringing on other wells in order to keep production flat.

Atl+TH+Tahiti+BF

The above chart is combined liquids production of Atlantis, Thunder Horse, Tahiti and Blind Faith. The last data point is September 2013.

Read More