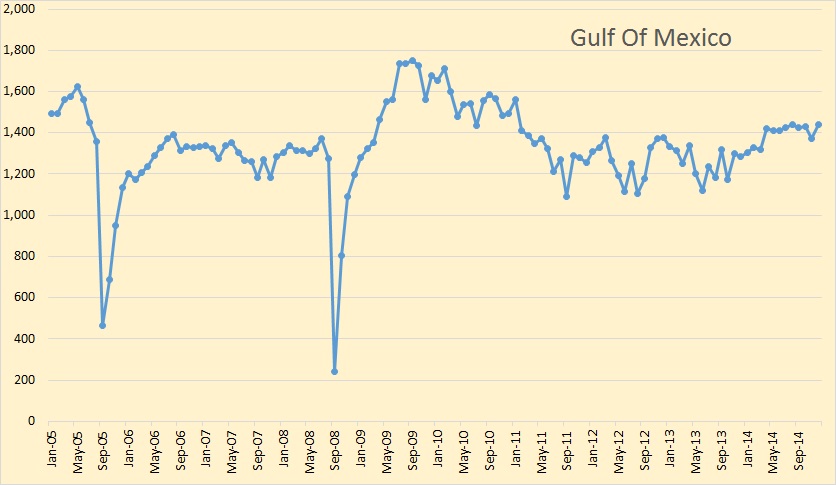
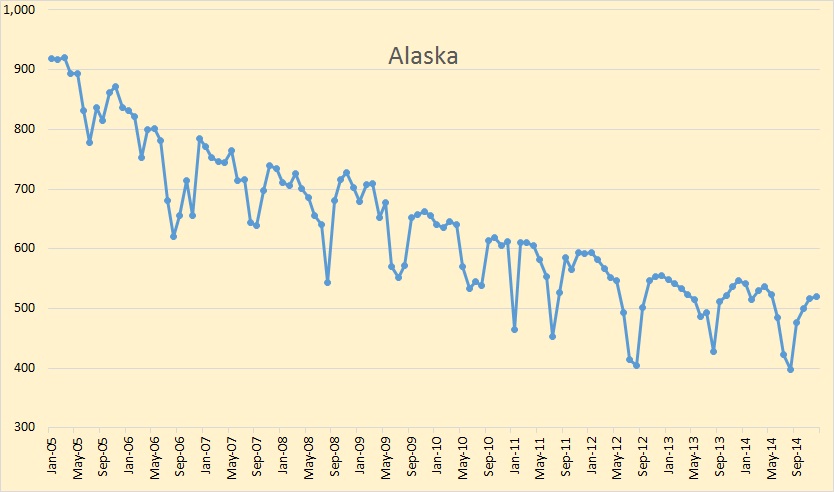
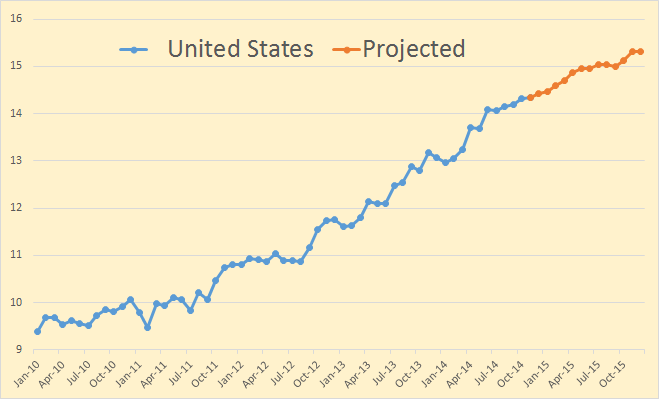
US Individual States Production, Bakken Area and GOM

The EIA’s Petroleum Supply Monthly has been published with production data for all individual states and offshore areas.  All data is Crude + Condensate and in thousand barrels per day with the last data point March 2014.

Mont+ND


Since the Bakken occupies part of two states, North Dakota and Montana, I have combined their production in order to get a better idea of what is really happening there. I have drawn a trend line from July 2011 through October 2012. That shows where production might have been if the fast decline rate and bad weather had not caught up with the. Production was 1,050,000 barrels per day in March, still 5,000 barrels per day below the point reached in November.

ND and Montana Change

I wanted to show this chart so we could get a better idea what is really going on in the entire Bakken area. Back in May and June of 2012 production was increasing by an average of 23,500 barrels every month. Now production is increasing by an average of 15,580 barrels per month.
Read More

JODI, the EIA and Their Data

There has been very little new data to report lately. The JODI, Joint Organizations Data Initiative, data for March came out a few days ago. JODI is very good as far as the data it reports goes. The problem is there is a lot of data they just don’t report. If a country does not report their production for a given month then JODI just leaves it blank. And some countries they can’t seem to get any data from, so JODI just gives them zero for every month. For those countries I just substitute EIA numbers.

As far as OPEC goes JODI is very political, reporting the inflated numbers that Iran and Venezuela report. I use instead the EIA data for those two countries.  Anyway here is what I have from JODI. The Data is in kb/d, last data point March 2014:

JODI World Total

But for a few countries JODI is a pretty good data source. Russia is a good example.

JODI Russia

JODI has Russia peaking, so far, in November at 10,127 kb/d and now about 100 kb/d below that point. Analysis have, for years, been expecting Russian production to decline but new fields in Siberia have kept inching up a little bit each year. But with over 60% of their production still coming from Western Siberia’s giant, largely depleted, fields it looks like that long overdue decline may have finally arrived.
Read More

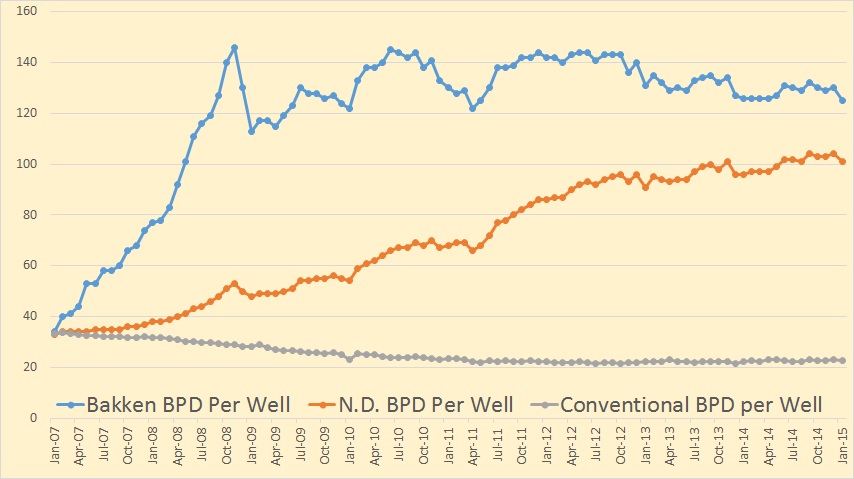
The EIA’s Drilling Productivity Report, Is Productivity Really Improving?

The EIA just published their latest Drilling Productivity Report. They kept their very linear increase for all LTO plays except for the Bakken. Strangely they updated their Bakken data right up through January according to the data they apparently received from North Dakota.

DPR Bakken

The last data point is February for the North Dakota data and May for the DPR data.

But the EIA posted some strange Legacy Decline numbers for the Bakken;

Bakken Decline Chart

Now this just doesn’t make any sense. The legacy decline is supposed to be the number of barrels per day all the wells in the combined declined. That number should increase, but gradually as new production comes on line. That is the more production the greater the decline. They have the decline rate at 60,553 bp/d in November, jumping to 123,248 in December, then falling back to 63,459 in January. That is impossible! The decline, in barrels per day, increases as production increases. But if production decreases then the number of barrels per day that declines must decrease, not increase.

Read More

Bakken Update February Production Numbers

The latest Update on Bakken and North Dakota LTO production is out.
ND Monthly Bakken Oil Production Statistics (Bakken Only)
ND Monthly Oil Production Statistics (All North Dakota)

Bakken Barrels Per Day

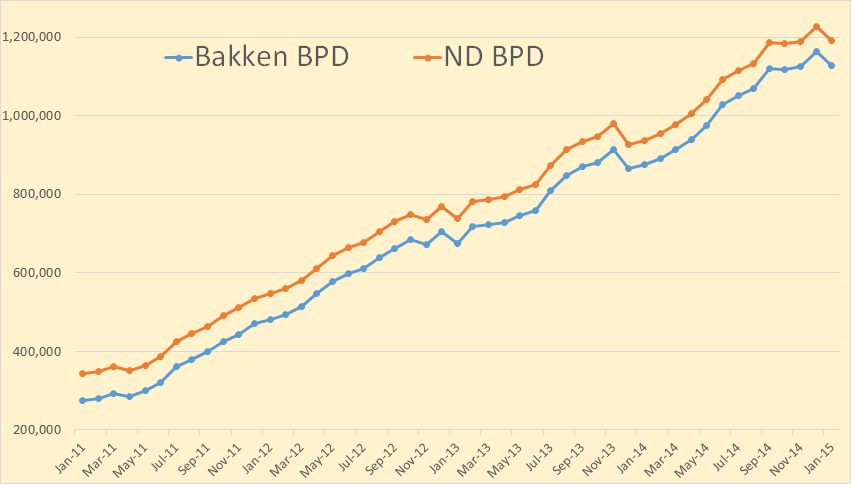
Bakken production in February was 888,398 barrels per day and all North Dakota February production was 951,350 barrels per day. Some revisions were made in the past production numbers. Only the last three months were significant however. Listed below are the actual production changes, per month, for the last three months:

Month         Bakken       North Dakota
Dec 13      -45,528        -40,284
Jan 14         6,542           -2,218
Feb 14       16,643          16,224

The Director’s Cut for this has not been published yet. I will update this post when it has been.  There were 119 additional wells in the Bakken and 79 in all North Dakota. That means a lot of North Dakota Wells were shut down.

A Bismark engineering firm has calculated the probable Bakken Peak.
Competition from Texas, winter expected to limit ND oil production

MINOT, N.D. – North Dakota oil production, which is poised to break the 1 million barrels per day benchmark, will peak at 1.2 million to 1.5 million barrels per day over the next five years, limited by winter weather and competition from Texas, a Bismarck engineering firm said this week.

I have charted that prediction below. The figures are the average yearly production.

Bakken Engineering Firm

Read More