JODI Data and Giant Field Depletion

I am starting this post off with a news article because it explains why JODI has U.S. production numbers wrong for July.

No, U.S. Oil Production Probably Didn’t Rise in July

The Joint Organizations Data Initiative (JODI) releases monthly oil supply-and-demand data for about 80 countries, which it gathers by directly surveying the countries. It is widely cited by analysts, especially for its figures on demand, imports and exports.

The latest JODI data released Sunday showed that U.S. crude-oil production rose from 9.3 million barrels a day in June to 9.5 million barrels in July.

But the EIA’s latest forecast called for July production to fall to 9.2 million barrels a day in July, continuing the trend of declining U.S. production as companies cut spending in the face of low prices.

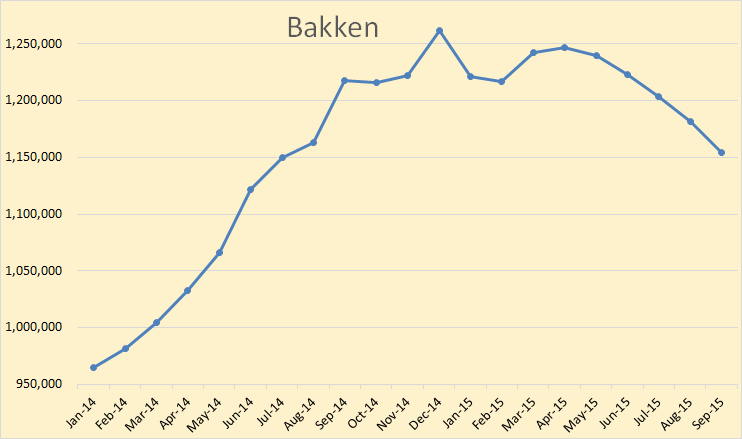
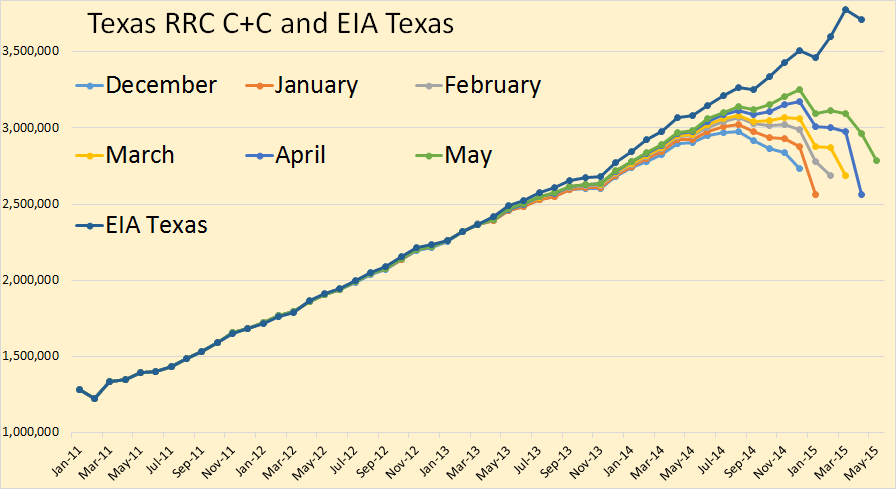
For the charts below I have used JODI data for all Non-OPEC nations except those that do not report to JODI. For them I use the EIA data and carry forward the same data that the EIA reported, (April). For the USA, since the JODI data is obviously wrong for July, I simply carried forward the June data which also came directly from the EIA. And for OPEC I use the OPEC MOMR’s “secondary sources”. JODI also uses the MOMR for their data but uses the “direct communication” data instead of the secondary sources data.

The data below is through July 2015 and is in thousand barrels per day.

JODI World C+C

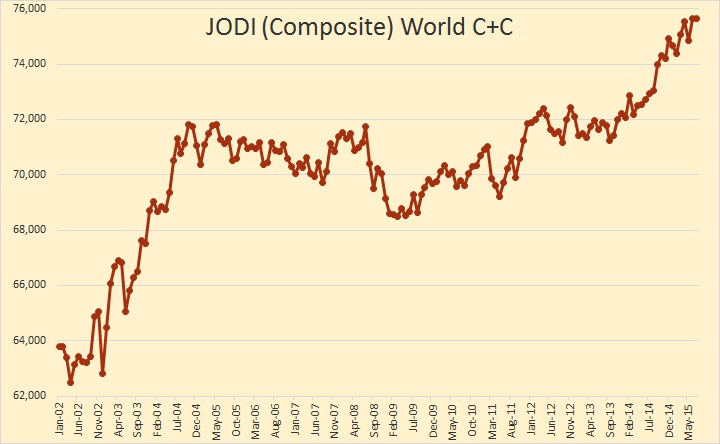
In July we remained at or near the world’s all time peak at 75,631,000 barrels per day, down just 15,000 bpd from June.

Read More

US Shale Declining and OPEC Still Climbing

There is new data out today. The EIA published their International Petroleum Statistics yesterday. The EIA also published their Drilling Productivity Report which gave their expected shale oil and gas production through September. Then this morning OPEC published their Monthly Oil Marketing Report with OPEC crude only production numbers through July.

First the Drilling Productivity Report. Of course most of the Drilling Productivity Report is projection, not history. And that projection goes through September 2015.

Bakken

The EIA has the Bakken peaking in December and declining 107 thousand barrels per day since that point. A secondary peak was reached in April and declining steadily since then.

Read More

US Oil Production Finally Starting to Decline

There has been very little data to post about recently and as everyone should know by now, I post primarily about data. So if there is no data there is not much to post about. Also I have been very busy for the a week now and have checked in only a couple of times.

A few days ago a very racist post was posted on this blog. I completely overlooked it as I seldom scan the posts because I get an email for every post so I just read the posts in the emails. But when there is a guest post, as the one last week was, I get no emails, the guest poster gets them instead. Anyway I deleted the post and banned the poster. I also banned another poster because he accused me of deliberately letting the post stay up. That outraged me. It was the same thing as accusing me of such racism.

Read More

Texas RRC Oil & Gas Production

The Texas RRC Data is out. All RRC data below is through May. The EIA data is through April.

Texas C+C

There appears to be an increase in Texas May crude oil production. You will notice that the EIA has departed from their usual practice of just estimating Texas C+C production up about 50,000 bpd for every month for the last six months or so. They have a new method or estimating Texas production which is explained in the first link below the charts.

Read More

Oil Shipments by Rail Declining

Weekly oil shipments by rail can be found on the web at Weekly Carload Reports. And a summation of that data with charts can be found at Association of American Railroads  Freight Rail Traffic Data.

Rail Oil Carloads 3

Crude oil by rail basically started with the shale boom. Prior to that almost all oil was shipped by pipeline. Of course a lot of oil was trucked to the pipelines. The EIA says in the first seven months of 2014 8 percent of all us crude and refined products was shipped by rail. It looks like that percentage was increased somewhat in the second half of 2014.

Read More